

Nine Steps to Success™ – Step 5 Performance Measures
Performance Measure is the fifth step of the Balanced Scorecard Institutes framework for strategic planning and management, the Nine Steps to Success™.
In business, government and non-profit organisations we measure a multitude of things. We do this to keep on track, to make improvements and to drive our strategy. Unfortunately, where we may think we have a decent set of key performance indicators, actually we have a hotchpotch of tasks, objectives and projects with a few badly described metrics. So what is a performance measure/KPI?
Note: A Key Performance Indicator (KPI) is often referred to as Performance Measure. This is perfectly valid, the important thing is the definition not the label, if Performance Measure is term generally used in your organisation, then use it. In a formal Balanced Scorecard structure, as defined by the Balanced Scorecard Institute, the term Performance Measure is used. More frequently in business KPI is used. For the purpose of brevity, the term ‘KPI’ will be used throughout this document.
A Key Performance Indicator is something that can be counted and compared; it provides evidence of the degree to which an objective is being attained over a specified time.
The definition above includes a set of words that need further explanation to ensure the statement is fully understood:
Counted: This may seem a little trite, however, counted means that a quantity can be assigned. A number or value. It does not mean a percentage achievement. One of the most frequent mistakes in setting KPIs is to create a project and assess its success through how much work has been done. Just because an e-mail marketing campaign has been active for three weeks out of four does not mean it has been a success. Success is dependent on the outcome not the activity.
Compared: A number or value may be interesting but it only becomes useful when it is compared to what is optimal, acceptable or unacceptable. Every KPI must have a comparator or benchmark. Using an industry benchmark gives an objective quality to the comparator, objectivity is not required, but it is desirable.
Evidence: The evidence will fall out by ‘counting’ and ‘comparing’ correctly. It is important to strive for a measure that will be observed in the same way by all stakeholders. The evidence should be clear and have specific meaning.
Objective: A KPI only has significance if it is contributing to an objective. If there is no objective, why is it being measured in the first place? This does not mean we should ignore all operational measures; they still need to be in place – but even as sub-measures they should contribute to an objective.
Specified Time: Everything is time bound; progress towards meeting an objective and therefore a strategy must be measured over a specified period of time.
There are three main stages in the process of developing meaningful performance measures (Intrafocus has developed a seven step methodology covering these three main stages as described in the Intrafocus white paper; Developing Meaningful Key Performance Indicators), they are:
1. Describe the Result
2. Describe the Measures
3. Describe the Thresholds and Targets
Describe the Result
For each Objective that was created in Step 3 –Strategic Objectives, there should be a desired result for that Objective. It is essential create a result for each objective using a results-oriented language. This forces us to think more precisely about what we are actually trying to achieve.
In business we have a tendency to use words and phrases like ‘best practice, optimised, world class, efficient, effective, productive. Although the implied meaning behind these words and phrases is positive, the actual meaning is vague. Objective Results using these words are not results-oriented and therefore will always fall short if used when related to performance improvement. It is always better to use words that have common meaning and cannot be vaguely interpreted.
Using words that relate to how we physically perceive things in the world is a good technique to sense-check you are on the right track. For example, the objective: “Reduce the sales cycle” may have a result described as: ‘Reduce the time taken to convert a qualified lead into a sale’. If we think about how this might be physically perceived, we may change the result to ‘reduce the number of days to convert a qualified lead into a sale’. We now have an objective with a result that has full clarity in interpretation.
Describe the Measure
Generally there are two types of measure that can be described, Direct and Indirect. Ask the question: “Can the intended result of the objective be measured directly?” In other words, is there a clear and unambiguous way to determine the success of the result? If we take the example objective “Improve service delivery’ with the intended result of “Service delivered on time” the answer is yes, we know how long it should take and can measure against that. In the case of a direct measure, we can go straight to describing the measure.
In the case of an indirect measure, an additional step is required. Taking the example of the objective “Improve company brand image” with the intended result “Our company on-line reputation improves” there is no clear measurement that can be made. In this case we may look at other indicators that correlate to the intended result, for example “number of positive comments made on our Facebook pages”. The logical correlation is that if there are a growing number of positive comments, then our reputation will improve.
This is not the whole story for indirect measures. In the example above, there may be an increase in positive comments; however, there may also be an increase in negative comments. To ensure the right measure was put in place we may want to create a composite measure, for example the number of positive and negative comments as a ratio or percentage. Therefore in the case of indirect measures the second step is to undertake some analysis using methods like logic models, cause-effect analysis or process-flow analysis to determine what measures to use. The balanced scorecard methodology favours the use of the Logic Model.
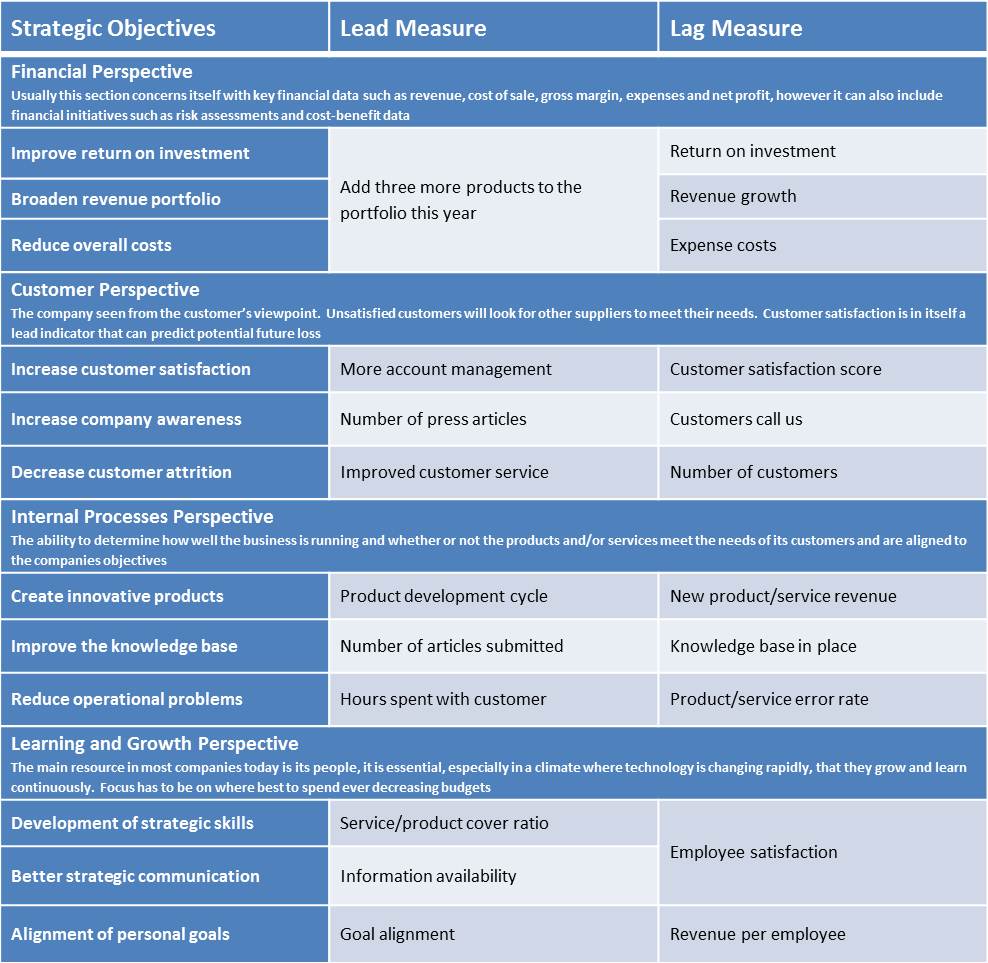
At this point we should consider lead and lag KPIs. Even a cursory study of the principles of business performance management will show that all too often our KPIs concentrate on ‘lag’ measures. That is, those measures that occur after the event. Nearly all of the financial measures fall into this category, revenue, gross margin, profit, costs, they are all things that we measure after an event has happened. We need to do this, as we can learn and adjust, but the act of measurement does not cause change. Why do we concentrate on lag measures? Simply because they are easy to count and provide proof of success or failure. If I get on the scales they tell me whether or not I have lost or gained weight. If my objective is to lose weight, getting on the scales has not helped. However, if I measure how many times I go for a run and how much I have eaten (and plan for this) then I have put in place two ‘lead’ measures that will help me succeed. Lead measures are harder to identify but they are the only measures that can be influenced and therefore make a difference.
The KPI needs to be calculated and ownership assigned – Ownership and calculation have been put together intentionally. Practically speaking, assigning ownership of a KPI should be undertaken before the calculation is made to ensure the right person is responsible for the activity. This begins to highlight the importance of ownership. To get anything done, all objectives and KPIs must have owners and that means an individual not an entity such as a department.
There are two types of ownership we need to concern ourselves with: Owners and Updaters. An owner is the person who takes full responsibility for the KPI. The updater (who could be the owner as well) is the person who gathers the required data and updates the KPI when required. An updater could report to the owner or be a shared administrator.
For each KPI the following things need to be taken into consideration:
Description: A sentence to describe as accurately as possible what the KPI is for.
Label: The short description, used for presentational purposes, generally 3-5 words.
Owner: The individual who owns and will drive the KPI (this applies equally to objectives, indeed, ownership of objectives is more important than ownership of KPIs as the former drives the latter).
Updater: The individual who is responsible for updating the KPI on at the pre-defined times
Calculation: A mathematical formula that describes how the data elements (tangible perceivable items) are combined to provide a number, percentage or currency (sometimes a yes/no).
Frequency: How often the KPI is counted and recorded.
Scope: What should be included or discounted, often a cap or data range.
Metrics used in calculation: The data and the sources of data used in the calculation, it is important to provide a description of the metric items individually to avoid ambiguity.
Describe the Thresholds and Targets
A KPI is meaningless unless it can be compared to something. The actual value of the measure has to be compared to what would be considered good, bad or indifferent. The comparator could be a target based on previous performance or on a notional future performance or even a made-up value. Whatever the target, it needs to be considered as reasonable and achievable.
Targets are well understood when looking at financial measures; we often look at a ‘variance’ to an expected result. For example if expected monthly revenue was £325k and the actual revenue recorded was £309k the variance would be -£16k. This may or may not be a cause for concern depending on what was considered an acceptable variation to the target. For a KPI to be useful we need to clearly state both an acceptable and unacceptable result. This is known as defining ‘thresholds’. There are several threshold models available, for the purpose of illustration let’s look at the most common: Red, Amber, Green (RAG). In the RAG model there are two threshold points:
• When the KPI should turn Green
• When the KPI should turn Red
There are no hard and fast rules to the meanings attributed to each of the coloured areas but in general it is as follows:
• Green – an acceptable result, we are on target
• Amber – there may be a problem, we should investigate
• Red – an unacceptable result, there is a problem that needs rectification
By looking at an example KPI: “Large order sales cycle” we can illustrate as follows:
• Green – 60 days or less
• Red – 80 days or more
When these thresholds are entered into a performance management system like QuickScore the result might look like this:
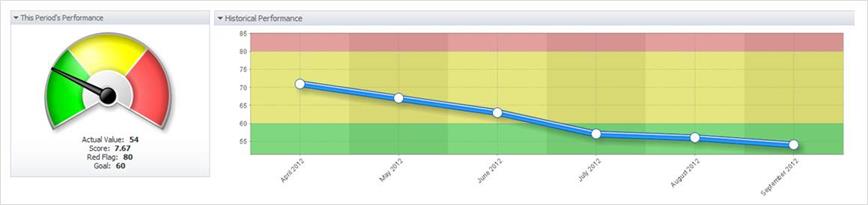
As can be seen, by setting threshold values the viewer can instantly and very graphically see the current situation and equally importantly the history leading to this point.
Finally, all of the above has to be recorded, this is best achieved by using a standard format for each performance measure, by way of example, using the ‘Large order sales cycle’ KPI, you might end up with something like this:
In conclusion, when developing meaningful key performance indicators it is important to focus on intended results and always keep in mind what the company or organisation is trying to achieve. Also bear in mind that research has shown that companies that are managed using metrics are usually much more effective than those that are not.
Performance Measure is the fifth step in a strategic planning journey. The Nine Steps to Success™ is a strategic planning methodology created by the Balanced Scorecard Institute. For more information on how to be trained as a Balanced Scorecard Profession (BSP) visit our training pages on the website.
