
Seven is the Intrafocus methodology that guides you through the process of developing clear objectives and performance measures to support your company strategy. It ensures performance measures have targets and provide evidence that objectives are being met or not. Once performance measures have been defined, they need to be presented in a way that will allow quick and easy interpretation. Finally, the information needs to be acted upon in such a way that it will move you closer to your objectives and ultimately to your strategy.
Once you have chosen a business performance management system, you need to ensure the data you put into the system is going to help drive your business forward. It is tempting to measure far too much and not be specific in the hope the ‘system’ will sort it out. The Intrafocus Seven methodology will help ensure you do what is right for your business.
The key is to start small, even as small as a single objective will do. Once you are practiced in creating a few successful objectives and performance measures, then you can take up the company-wide challenge
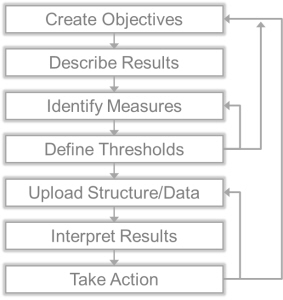
The Seven Steps methodology is template driven and requires you to go through the following steps. You may have to complete steps 1-4 several times. The first time through may take a while, thereafter, it’s a breeze.
Step 1 – Create Objective: An easy start, for any given area within the business, think of something that needs to be done to improve activities in that area and write it down. For example, in sales you may want to “Improve Sales Productivity”. Step 1 of the process will show you how to take an aspirational objective and turn it into a specific objective that has clarity in purpose, is a single objective and not a combination of many things.
Step 2 – Describe Results: Often objectives are written as activities, the example above “Improve Sales Activity” is exactly this case. It even has the word ‘activity’ in it. Worse still, objectives are often written as actions or projects, for example “Implement a Sales Plan”. This may be a worthwhile activity, but it is not a measurable objective. An Objective is not an activity or a project, it is a result. Step 2 takes the Objective and refines it to use terms oriented around results and language that is specific to outputs that can be measured. For example from the aspirational objective “Improve Sales Productivity” several objectives may be derived including “Reduce the time it takes to convert a qualified lead into a sale”. (Don’t work about the length of the sentence at this stage, it gets sorted out later)
Step 3 – Identify Measures: For each objective there may be several performance measures. The selection of the measures must be based on things that can actually be counted or calculated. The measures, like the objectives need to be written clearly. For the example above “Reduce the time it takes to convert a qualified lead into a sale” there are several things that can be counted: 1. The number of qualified leads, 2. The number of sales related to the leads, 3. The times taken to convert each qualified lead into a sale, 4. The average time taken to convert all qualified leads in to sales in a given period. Each of the measures has value, but it may be that measure number 4 is the only one of importance for the purpose of reporting. Step 3 goes through the process of identifying and writing down the performance measures associated to the objective and selecting the right measures based on importance to the viewer/stakeholder. It is also at this point that ‘owners’ and ‘updaters’ of the objectives and performance measures are decided. It is only when an objective and performance measure has an owner and an updater (it could be the same person) that accountability for performance improvement becomes viable. Without ownership there is no responsibility or accountability.
Step 4 – Define Thresholds: A performance measure is meaningless unless it can be compared to something. The actual value of the measure has to be compared to what would be considered good, bad or indifferent. The comparator could be a target based on previous performance or on a notional future performance or even a made-up value. Whatever the target, it needs to be considered as reasonable and achievable. Step 4 goes through the reasoning behind setting a target value and then on to define ‘threshold’ values. These enable the performance measure to be viewed not only as a number, currency or percentage but also visually. For example red = unacceptable, amber = in need of explanation and green = acceptable. A standard red/amber/green may not be the best visualisation for a metric. In some cases there is a need for a ‘stretch’ value and so a fourth colour, say blue, may be added. In other instances a red/amber/red visualisation may be required e.g. for something like a ‘training budget’ where a minimum spend is required but also a maximum cap.
Step 5 – Upload Structure/Data: It is only at this stage that the objectives and metrics ‘structure’ should be loaded into a performance management system. Most systems will allow you to move objectives and performance measures around after they have been loaded so it is not yet necessary to have a clear view as to what the overall structure should look like. In most cases, starting with an organisational structure or a balanced scorecard four perspectives structure is perfectly acceptable. Step 5 shows how to build a scorecard structure in QuickScore or Scoreboard, entering objectives and related performance measures and then arranging them for ease of access by owners and updaters. System and user permissions are also set during this phase. Once the structure has been created then the performance measure actuals can be updated/uploaded on a regular basis.
Step 6 – Interpret Results: Once a set of objectives and performance measures has been entered into the system then the job of interpreting the results can be started. There are two phases to this activity, first to create a set of meaningful dashboards and reports from the data and second to interpret the results as displayed on the dashboard and in the reports when actual values have been entered. The first task, creating dashboards and reports, is a one-off activity that will require modification over time. The second, interpretation, is an on-going activity that occurs during the reporting cycle, usually monthly. Step 6 provides the training required to build dashboards and reports based on the objectives and performance measures uploaded into the system. The on-going interpretation of the actual values should be self-evident based on the work already completed in setting up the system, defining thresholds and creating dashboards and reports.
Step 7 – Take Action: The raison d’être behind performance measures is to take action when improvements or changes need to be made. Performance measures provide the evidence that an objective is either being met or not. Any performance measure that shows (through the correct interpretation) that an objective is moving in the wrong direction needs to have an action associated with it to remedy the situation. The action may take the form of a task, project, activity, budget change or simply to remove the objective. Step 7 looks at how to best put a physical link between failing objectives and tasks to ensure action is not only taken but monitored until successful conclusion.
The Intrafocus Seven methodology has a primary goal to ensure that valid performance measures can be created, monitored and acted upon to ensure that the right objectives are established to contribute to a company strategy.
For more information and a free document with templates to guide you through the process go to the consulting page on the Intrafocus website.

