
Spider Impact by Spider Strategies is one of the world’s most popular strategy and KPI management tools. Learn how to use it at your own pace and build a unique system.
The Basics
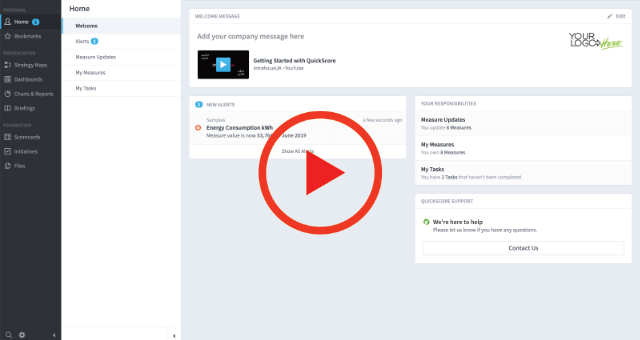
Logging in and the Home Page
Many of the day-to-day operations such as updating measures and viewing tasks can be undertaken from the home page
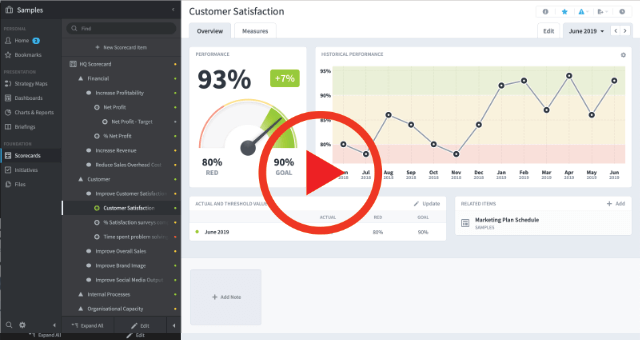
Create a Scorecard
Build any type of scorecard you need. look at company-level data, financial data, marketing, sales, whatever is required.
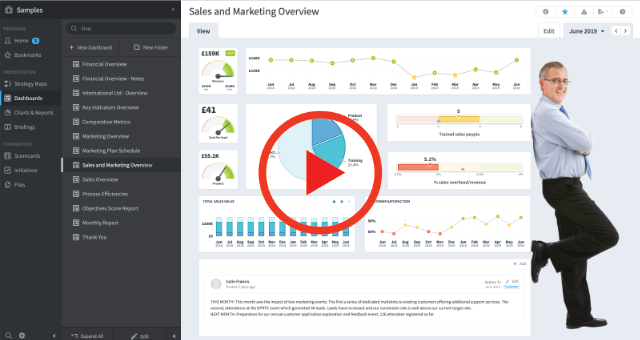
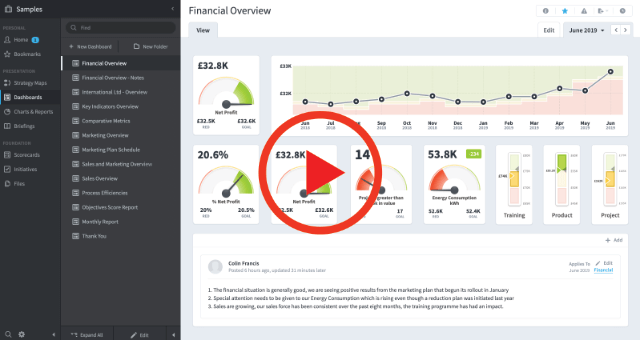
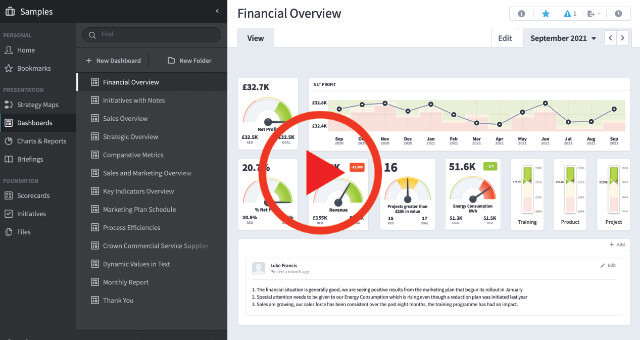
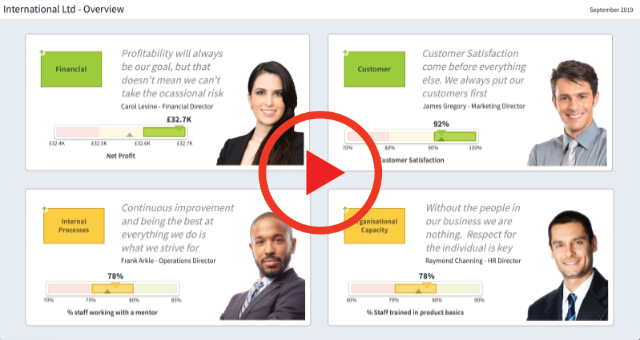
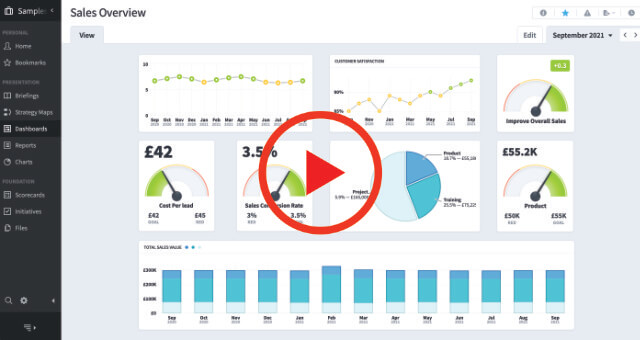
Build a Dashboard
Create dashboards easily to aggregate your data in to a meaningful displays to help drive your business
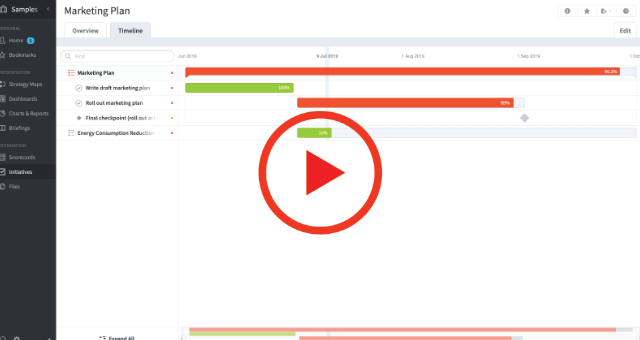
Initiatives, Tasks & Milestones
How to create initiatives, tasks and milestones and how to relate them to objects in a scorecard or dashboard.
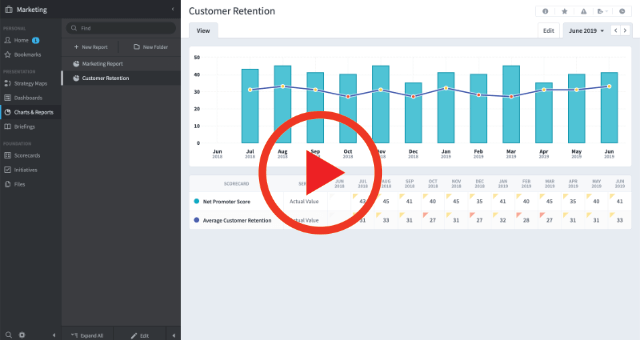
Creating Reports
How to build reports to view your data in a classic row and column format from scorecards, datasets and Initiatives.
Creating Charts
Add some charts including line, bar, pie, doughnut, and many more. Enhance you charts with analytics like trend lines.
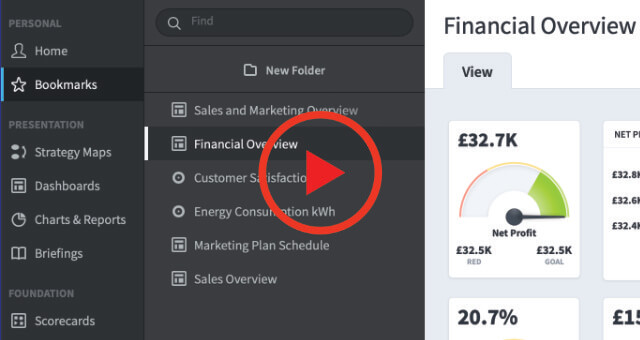
Adding Bookmarks
Add personal bookmarks to your instance of Spider Impact so that you can get to what you want quickly and easily.
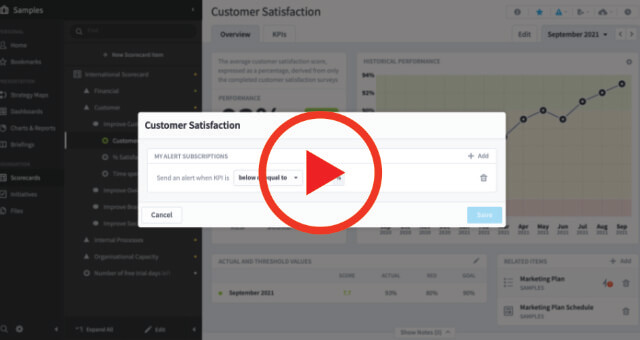
Setting Alerts
How to set alerts for Scorecards, Themes, Objectives, Measures and Notes. An Alert will send an e-mail to the subscriber
Advanced
Copy and Copy as Template
How to copy a whole Scorecard and/or Copy at a Template and roll-up values and targets.
Creating & Using Datasets
This is the Business Intelligence layer of Spider Impact – Import huge datasets to slice, dice and use the data.
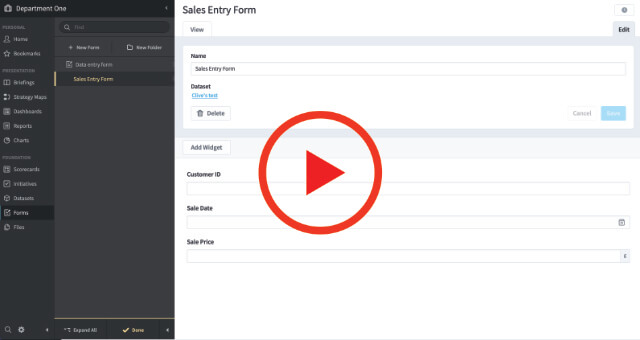
Creating and Sharing Forms
Forms allow you to create a variety of input forms based on Datasets (Dataset option required).
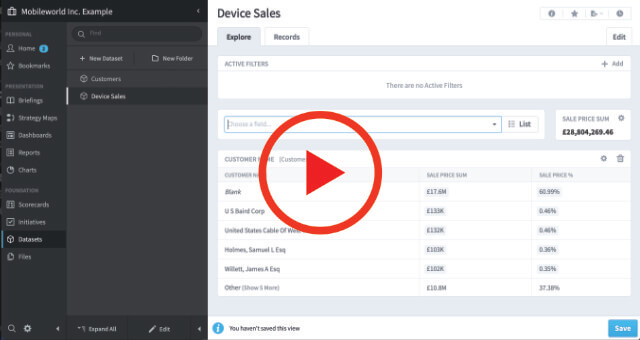
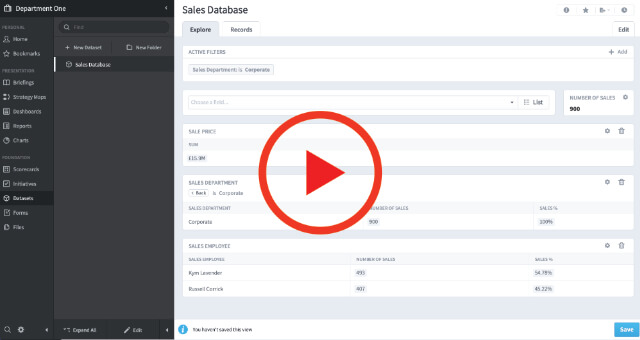
Datasets (Business Intelligence)
Large volumes of data can be imported into Spider Impact and then sliced and diced to provide reports and measures.
Importing Data
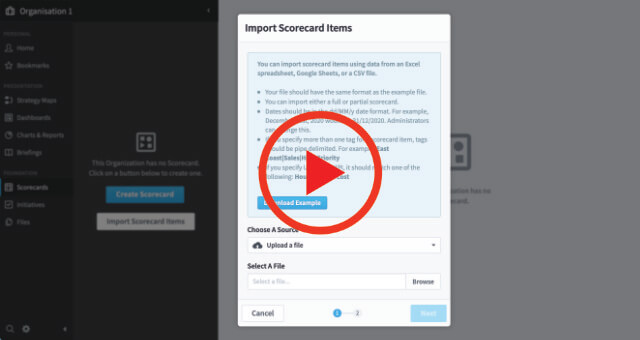
Importing Scorecard Structures
Scorecard structures can be built manually or imported from a predefined spreadsheet and then updated.
Importing Using Zapier
Import data from thousands of applications. Using Google Analytics as an example, including transformations.
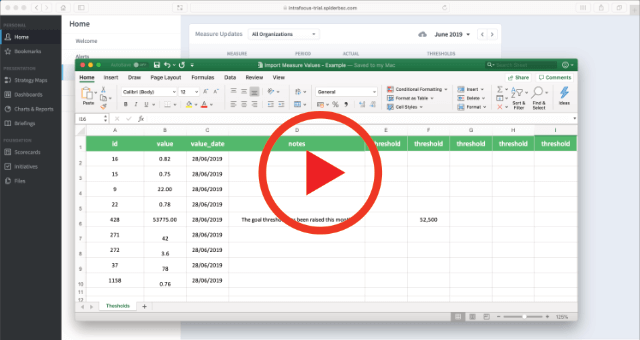
Simple Spreadsheet Import
Update your measure values by using a spreadsheet, sometimes a quick option if you have twelve or more measures
Importing Historical Data
How to import historical data from a spreadsheet. Sample Spreadsheet: Historical Data
Import for a Specific Date
Importing data for a specific date. Sample Spreadsheets: For a specific date, or for multiple dates, or Initiatives/Projects
Presentation
Scoring and Colours
All values in Spider Impact are normalised and then scored to a value between 0-10. This means Scores can be easily rolled up.

Collating a Briefing
How to build a presentation pack (called a Briefing) and display it online or export it to a pdf, PowerPoint or Word document
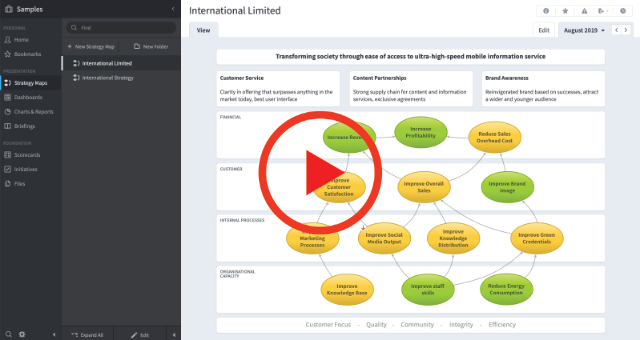
Strategy Maps
A Strategy Map is a special type of dashboard. It can be auto-generated in Spider impact.
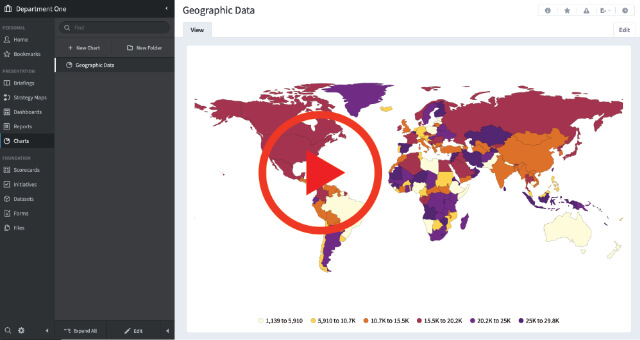
Geographical Data Maps
Create geographical data maps based on geographic data pulled from datasets. (The Dataset option needs to be enabled)
Administration
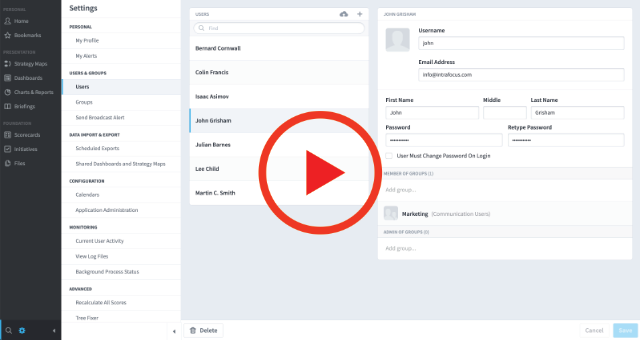
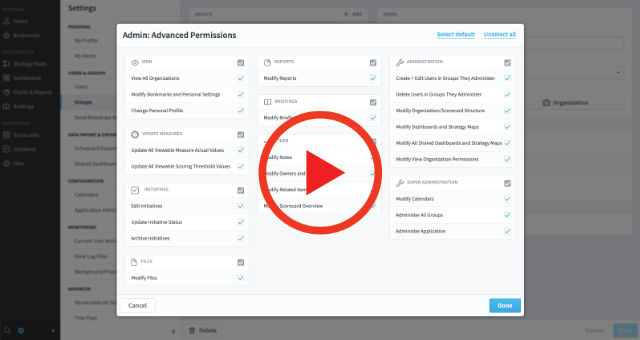
Creating Users and Groups
All users in Spider Impact must be added to a Group. Permissions can then be applied to the group.
Creating a Calendar
How to create and modify both standard and custom calendars within Spider Impact.
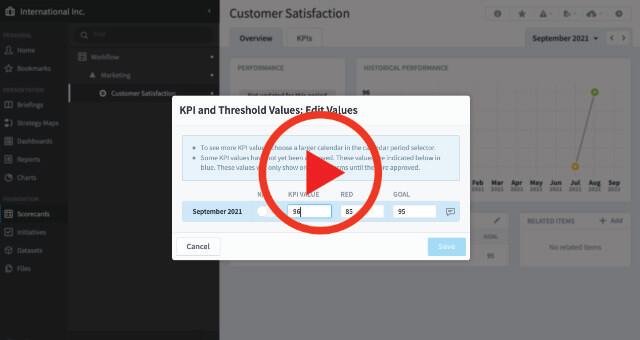
KPI Value Approval
A simple workflow can be enabled to force ‘Owners’ to approve KPI values before they are displayed in Spider Impact
Replace a User
How to replace an existing user with a new one in Spider Impact (Use Creating Users to add a new user to the system)
Shared Dashboards
Dashboards can be shared externally in any browser, rendered direct from QuickScore, not a picture or image
Both Spider Impact® and Spider Strategies® are registered trademarks of Spider Strategies, Inc.