Welcome to our latest ‘January refresher’ article for 2020. This time we are looking at how to construct a useful KPI.
We will look at how to combine your KPIs in a way that actually provides value to decision-makers and we’ll touch on building a KPI dashboard – but save that topic for a ‘deep dive’ refresher in our next article.
So, first of all, let’s take a closer look at the construction of a good KPI.
How to build useful KPIs
As we know, a Key Performance Indicator, or KPI, exists to measure organisational performance and the progress towards strategic objectives and goals.
Although every KPI will be different, it will share a number of characteristics. For example, a KPI will:
- be related to an objective.
- have a target, and an associated red, amber and green (RAG) threshold to visually signal progress towards this target
- be something that can be counted to prove that it is in place
- be a quantifiable measure that can be compared against a benchmark, or comparator
- be possible to evidence it in a clear, consistent way that is understood by all stakeholders
- be time-bound.
Why do KPIs need to be linked to objectives?
Perhaps the most important rule of all is that any KPI must be linked to a strategic objective or goal. Without this intrinsic link, the KPI isn’t actually ‘key’ and serves no strategic purpose. Yes, there will always be other organisational metrics to measure – for example, operational contract measures or cost metrics in a P&L, but these are not classed as Key Performance Indicators and shouldn’t be confused as such.
The Balanced Scorecard
As well as following the ‘golden rule of linking’ above, businesses must also take care to select a consistent set of KPIs that will be valuable for the owning department, as well as contributing towards the organisational strategy and its objectives.
Many choose to do this via a best practice framework such as the Balanced Scorecard. This proven approach helps managers to effectively performance manage their strategy implementation, by grouping measures under the four perspectives of finance, customer, internal processes and learning/growth. By doing this, managers can view the success of their strategy implementation in a balanced way, beyond pure financials.
Building useful KPIs for Objectives
Businesses are overrun with information and measures of various kinds. These can include contractual, legislative, accounting, ‘soft’ and other measures.
As mentioned previously, true Key Performance Indicators exist to measure strategic objectives. As a guide, each objective should have around three KPIs. Each of these KPIs must be related to the business or organisation’s improvement, but they can either be short-term, or tactical, or longer-term, strategic measures.
Additionally, some may be lag measures and some may be lead. What is the distinction? Lead measures are drivers and lag measures are outcomes. Both kinds are usually found within businesses. More on Lead and Lag Indicators.
The work required to identify and correctly structure organisational KPIs can take time and should be approached carefully. After all, the things that we measure in our business define what we then deliver!
At Intrafocus, we often support businesses in this process using a structured workshop. This can help to organise thinking and maintain the right level of focus.
The importance of contextualising KPIs
Once a business has a set of KPIs, it will then need to look at them together in a linked and contextual way. Why? Because when an individual KPI is interrogated in isolation it can cause local knee-jerk reactions that cause more harm than good to the overall strategic picture, or which – at best – simply waste time.
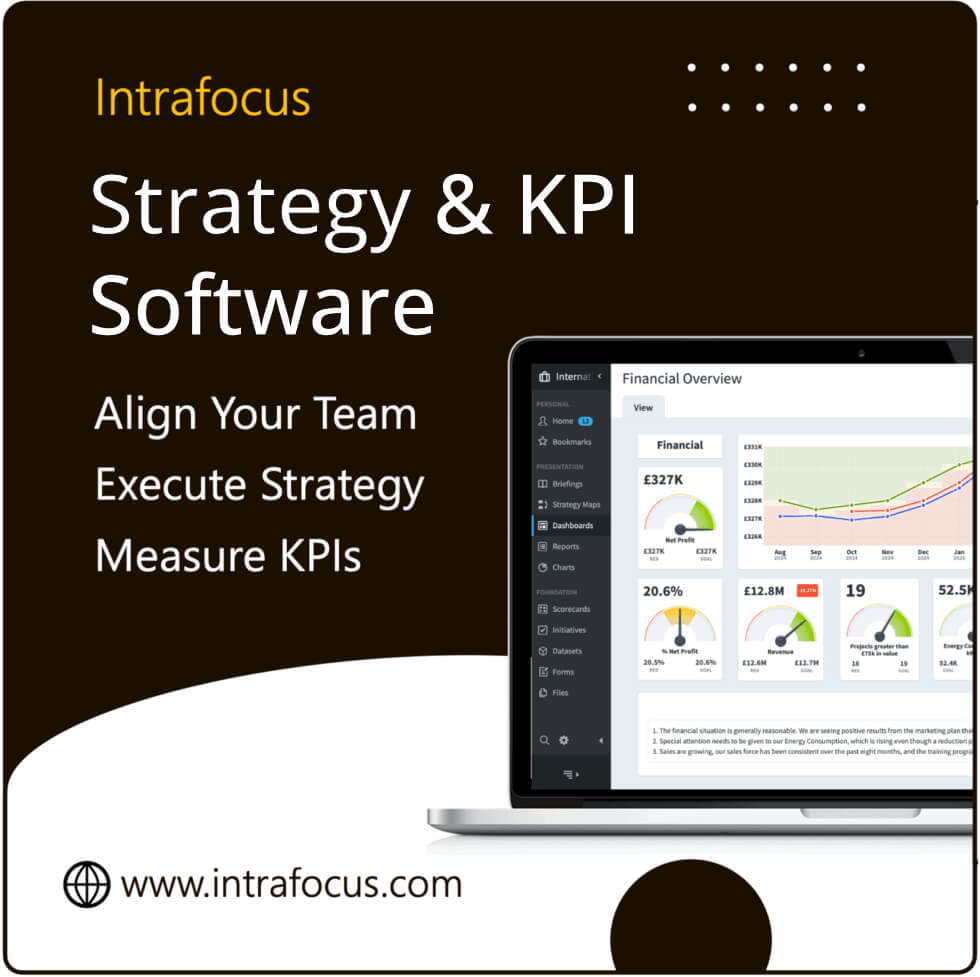
The best way around this common issue is to make sure your decision-makers have as much useful information to hand as possible to assist their work. This is most easily delivered via dashboards, which are designed to present KPIs in a way that is intuitive, full and insightful.
For example, dashboards can be used to demonstrate a KPI’s RAG status, to present comparator data, to add text context and so forth. Many of our clients choose to create and manage their KPI dashboards using a system such as QuickScore to automate the process as much as possible and to ensure the right quality of the finished piece.
With a professional dashboard containing all relevant KPI data in real-time, your monthly management meeting can be transformed!
Moving on to dashboards…
In our next article, we will review dashboards in more detail and refresh our minds about the things which make a strong dashboard that will add value to the business.
Find out more
At Intrafocus, we host strategy workshops for businesses of all sizes, and across all industries, using experienced and highly-knowledgeable facilitators. Our team of strategy consultants are here to assist you, wherever you are at in your strategic journey. Please contact us to find out more.