

Nine Steps to Success™ – Step 4 Strategy Maps
Strategy Map is the fourth step of the Balanced Scorecard Institutes framework for strategic planning and management, the Nine Steps to Success™.
There are two primary purposes for a Strategy Map, the first is to provide a means to create a coherent strategic story and the second is to communicate that story. It is well known that “a picture is worth a thousand words” (at least when attempting to communicate something quickly). A good Strategy Map is a picture that clearly demonstrates a cause-effect linkage between multiple objectives. From the bottom up it can tell the story to answer the question: “If we do this what will the result be?”
The Strategy Map is a tool that forces those involved in strategic planning to focus on the most important things. When completed it provides a visual representation that all employees can look at and see how they fit into the bigger picture. This is established in main by the use of the four Perspectives as described in Step 2, Strategy. The Strategy Map is also a logic map with a logical progression from bottom to top. It shows that if there is an improvement in an objective at a lower level, it in turn will cause an improvement to an objective in the next level up.
The following is an example of a strategy map:
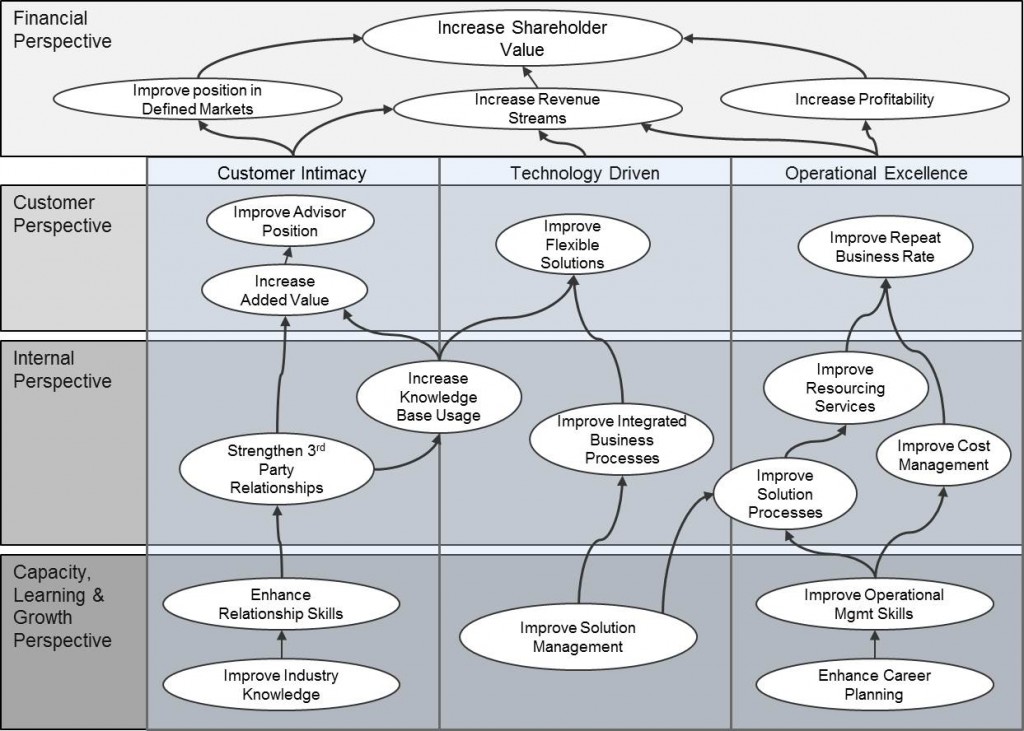
It should be noted that in the example above, all of the arrows flow upwards. As mentioned previously, there is a cause-effect relationship between objectives, for example from the above we make a statement like; “through enhanced career planning operational management skills will be improved causing our cost management to get better allowing us to price more competitively and sell more to existing customers and therefore increase profitability”. This is a very good example of being able to explain a Strategic Story.
There are a few more things that should be pointed out from the example. Firstly, it is generally good practice to connect objectives from a lower perspective to the one above it. However, this need not always be true, we can see above for example ‘Improve Industry Knowledge’ points to ‘Enhance Relationship Skills’ in the same perspective, the assumption here is if we improve industry knowledge it will give us the ability to enhance our relationship skills, presumably in the context of business relationships to help with the objective above it called ‘Strengthen 3rd Party Relationships’. There may be a case for combining the two lower objectives but provided the ‘strategic story’ is sound, it does not really matter at this stage.
Secondly, there are no feedback loops. The strategy map is not a process flow chart or a systems diagram. It is used to demonstrate cause-effect relationships. It can be read from the top down or the bottom up. The questions asked however will be different in each scenario. As mentioned earlier, when reading the strategy map from the bottom up the question to ask is “if we do this, what will happen.” For example, “If we improve solution management it will allow us to better integrate our business processes” When reading from the top down, we should ask the question “How?” for example “How can we improve integrated business processes? Answer; by improving our solutions management.” The ability to describe the strategy top down or bottom up provides a great management tool for both executive management and departmental management alike.
Thirdly, all objectives should have linkages. There should be no dead-ends in the lower perspectives. As a general rule there should not be links that pass through perspectives, there can be an exception to this rule in that an objective in the Internal Process perspective can link direct to the Financial perspective but this is not encouraged. The logic of the perspectives dictates that an improvement to be made in one level requires an improvement to be made in a lower level. To test this, simply ask the question “why is this objective in place, what purpose does it serve and what strategic result does it contribute to?”
Finally, using objectives that have been created in strategic ‘themes’ with associated strategic ‘results’ as the basis for your strategy map is a great way to start. In the example above there are 19 objectives and 3 themes. As mentioned in Step 3 Strategic Objectives, the optimum number of objectives should not exceed 12 for a tier one strategy map. There are very good reasons for this, not least of which is the law of diminishing returns. That is, the more you try and do, the less you will actually achieve! It is good practice to use the objectives created in strategic themes and then to rationalise them down to the required number though practices like ‘affinity grouping’.
In conclusion, do not be concerned about what you call the final output. It does not have to be called a ‘strategy map’. If ‘strategy map’ does not work in the culture of your organisation, then use a different name that motivates and has real meaning. There are many example of output that follow the strategy map principles but have been given different names, for example; The Way Forward, or Strategy 2010, or What we Make Matters. For more information on Strategy Maps and a set of template resources, go to our Strategy Map web page.
Strategy Map is the fourth step in a strategic planning journey. The Nine Steps to Success™ is a strategic planning methodology created by the Balanced Scorecard Institute. For more information on how to be trained as a Balanced Scorecard Profession (BSP) visit our training pages on the website.
