

Any given objective may have one or more associated metrics to determine its success or failure. When an objective can be measured through a 1:1 relationship, that is one objective has one metric, then the measurement process is usually quite simple. Monitor the measurements to determine the status and take action (or not). Usually, however, an objective will have several associated metrics and therefore progress against the objective is not so easily determined.
Let’s look at a fairly common example; Customer Satisfaction. Customer satisfaction is something that most organisations measure. The measurements can be undertaken in a variety of ways but normally includes things like: customer satisfaction survey, the number of positive or negative inquiries, the number of complaints received or customer retention rate.
Looking at all of these things individually can take time and will not give an accurate picture of customer satisfaction when taken in isolation. A common method used to resolve this problem is to create an index of a selection of relevant metrics to provide a Customer Satisfaction Index. The index can take scores from items that are measured less frequently, for example a customer satisfaction survey, and combine them with scores that are determined on a more regular basis, for example complaints received. This can provide a final Composite Index that can be looked at each month. The items can also be weighted to ensure the most critical things are highlighted. So the Key Performance Indicator (KPI) would be Customer Satisfaction Index and it would be calculated using several sub-metrics which can be made available for drill down if and when required.
In practical terms, the starting point would be to create a table to determine how to calculate the index. This will show us immediately that the actual values related to the metrics are of different types and therefore need to be ‘normalised’ into a common score. Typically a calculation will be used to create a normalised score between 0:10. The resulting table might look something like this:
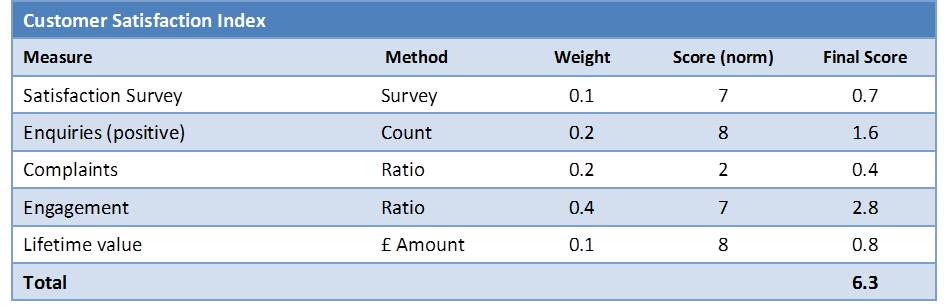 Figure 1 – Incorrect version of Customer Satisfaction Index
Great care must be taken when producing a composite index. In the table above, it can be seen that all of the scores, with the exception of Complaints, are considered better when high. Complaints, however, is considered better when low. Therefore, to ensure the composite calculation is correct, the normalised score for complaints (2/10) cannot be used. Using it would result in increasing the final score if more complaints were received. Clearly this is incorrect.
Therefore to resolve the problem above, either the Complaints metric should not be used, or a usable version of the Complaints metric substituted. In instances like this, when normalising the score, a calculation could be used to provide the inverse. However, this causes obvious complications when labelling the resulting metric. In this example it would become the number of ‘Complaints Not Received’ which makes no sense at all as you cannot count something you have not received. This certainly highlights the need for good metric descriptions and labels. Complaint is a measure that needs to be included in a Customer Satisfaction Index and the nature of the metric needs to be communicated effectively to avoid endless discussions about the metric rather than the result.
The most pragmatic way to resolve this problem is to label and describe the metric effectively. In the following example we have simply used the word Inverse. This is not actually mathematically correct, but it serves the purpose and the description narrative can be used to describe exactly what action has been taken i.e. the actual result has been turned into a value out of ten (2/10) which has been subtracted from the 10/10 to provide a normalised result (8/10) that can be used in the index.
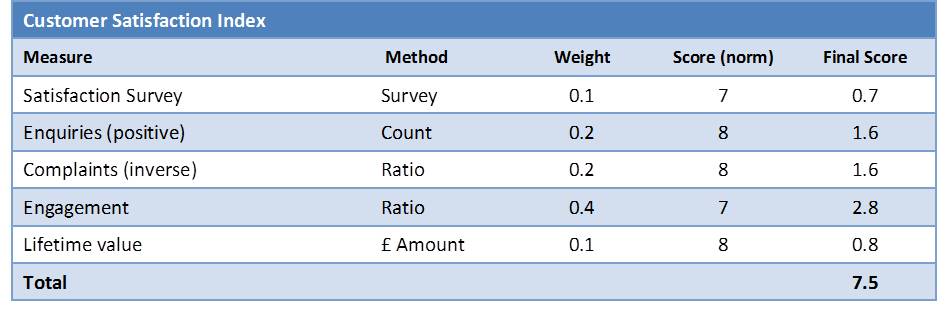
Figure 2 – Correct version of Customer Satisfaction Index
The resulting index value of 7.5 is the final score for the Customer Satisfaction Index.
For more information on how to handle scenarios like this Intrafocus holds Balanced Scorecard Certification classes in London in conjunction with the Balanced Scorecard Institute and the George Washington University.

