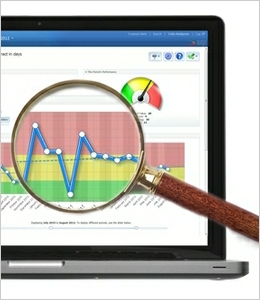
It was noted in last week’s Insight that 29% of Balanced Scorecards are managed using basic documents. These documents include free-form text, presentations and spreadsheets. It is the latter, spreadsheets, that are the most prolific. Creating a balanced scorecard using a spreadsheet is an easy task. Moving away from this environment should not be taxing and should offer advantages to the user. This has not always been easy in the past. When selecting balanced scorecard software care must be taken to ensure end users are not faced with complex set up procedures. The package should be as easy to use as a spreadsheet but off greater flexibility and functionality.
Trial, trial, trial! Whatever else you do as part of your evaluation, be sure to trial the software. If the vendor is not willing to let you have a trial, the chances are the software is not up to scratch.
Key Features (what to look for when selecting a solution)
Ease of Use – Ease of use is of paramount importance. Choose a product that functions like desktop software. For example, using left click to navigate and right click to develop. Look for products where data can be entered through the web interface, uploaded from a spreadsheet, or automated with a database connection. Products should be as easy to use as browsing a web page or shopping on-line.
Web Based – Look for a solution where development and deployment is done through a web browser. Cross-browser compatibility is preferred. Solutions using the latest J2EE technologies and Ajax-style page updates are in-line with the latest developments in web technology.
Strategy Maps – The key to a good Balanced Scorecard is the strategy map. Any product selected should have the ability to create strategy maps with drill-down capabilities. Strategy maps often start out as a blank canvas to which you add images, shapes, text, and numbers to create a visual representation of your data. Once you have made a strategy map, however, the colours and numbers should automatically update based on the real data in the system. Strategy maps can also be used to track key metrics, visualise geographic data, and monitor trends.
Cascaded Scorecards – Organisation-wide Balanced Scorecard roll-outs require multiple cascaded scorecards. This allows the organisation to start at the top and roll down into department, group, or even to the employee level. Look for products that allow for unlimited cascaded scorecards. Organisations should be able to drill-through to sub-scorecards or individual measure views. The entire organisation should be able to roll-up information from multiple scorecards into higher-level scorecards.
Scorecard Views – Organisations should select a solution that has many different ways to visualise Balanced Scorecard information. In additional to the Strategy Maps discussed above, other views could include Navigational, Executive, Overview, Metric, and Analysis.
Communication – Look for products that allow for commentary on each level of the scorecard. It should be possible to create comments that are either general or period specific. Alerts, such as when a metric needs updating (Notification), or when your metric turns Red (Push) are essential communication components.
Automated Scoring and Weighting – A scorecard tool should allow for automated scoring and weighting of structure elements. Building the structure, defining the weighting, entering the measure values, and then watch the scorecard “colour-up.”
Initiative Management – Many initiatives will come out of the Balanced Scorecard process. Look for products that have initiative management modules to manage these scorecard initiatives. It should be possible to create tasks and milestones and assign them to individuals or groups. All of the data should be able to be visualised with Gantt charts.
Report Writing – Reporting is still necessary in any scorecard initiative; getting the right information, to the right people, and at the right time is important. A good solution will come with a built-in report writer that contains sample reports like Red Metrics Report, Grey Metrics Report (missing values), and Metric Comparison Report (compares metrics within and across scorecards). The tools should also allow the user to pull data out of a scorecard database for ad hoc reporting. The report writer should allow for slicing and dicing of performance data and the ability to create presentation graphs.
Integration to Desktop Tools – The solution should allow the user to export graphs, reports, and scorecards to desktop applications like Adobe Acrobat, Microsoft Word, Excel, and PowerPoint.
Briefing Books – The tool should create on-line briefing books to consolidate data for management, groups, or users. Briefing books should be easy to set up by browsing the Scorecard model and adding views, reports, and graphs. Once the briefing book is created, it should be easily viewed on-line or exported to Adobe Acrobat, Microsoft PowerPoint, Word, or Excel.
Conclusion
Balanced Scorecard tools come in all shape and sizes ranging from desktop applications to ERP modules. Selecting the right tool depends on your organisational requirements. The basic premise, however, should be that the solution supports a structured approach, while being easy-to-use, easy-to-embrace, and routine when it comes to achieving results. A cost-effective, easy-to-use, web-based product that requires little or no IT involvement is ideal.
Intrafocus recommends Spider Impact, the only balanced scorecard software recommended by the Balanced Scorecard Institute. Intrafocus also runs Balanced Scorecard Professional certification courses.


