
Creating Scorecards
2020 UPDATE: QuickScore and Scoreboard are now Spider Impact
A quick reminder: QuickScore and Scoreboard are basically the same application. They run on the same codebase. The only difference is the terms used in the menus. QuickScore uses the Balanced Scorecard terminology so you will see words like Perspective and Measure. Scoreboard uses a generic business language, so you will see terms like Key Performance Area and KPI.
Defining the structure
Before you do anything else in QuickScore or Scoreboard you need to create a scorecard. Scorecard examples include the Balanced Scorecard, a Profit and Loss scorecard, a Marketing Objectives scorecard or an Operations scorecard. In fact, you can create any format scorecard you like to suit your business needs. The key point to remember is the scorecard must contain a set of Key Measures, often referred to as Key Performance Indicators or KPIs. Without KPIs, you have not created a scorecard. KPIs will enable you to keep track of your business activities.
Scorecard Examples:
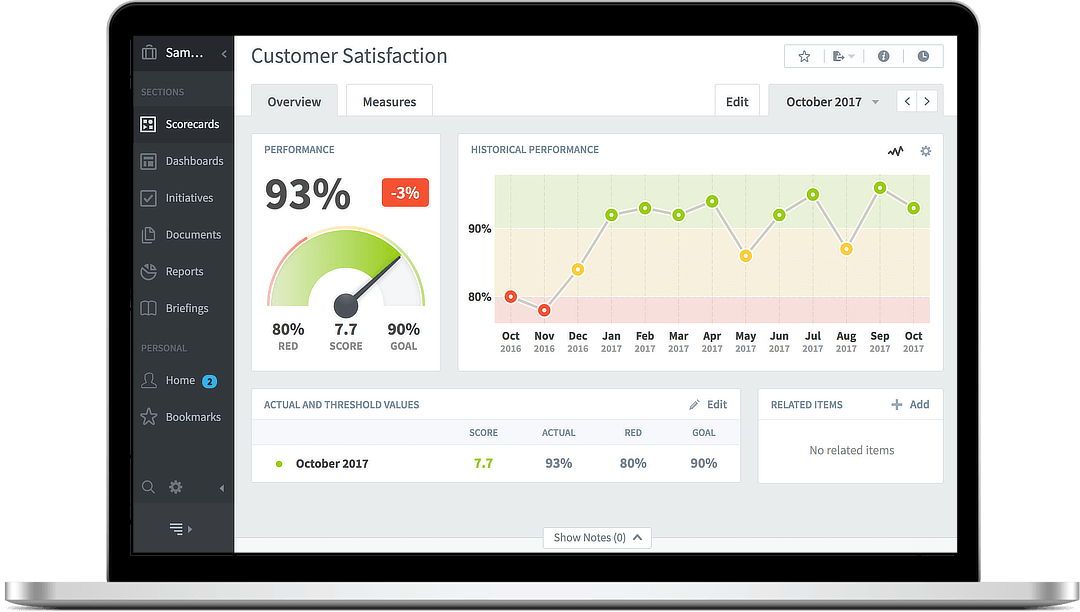
Example 1 – A Balanced Scorecard
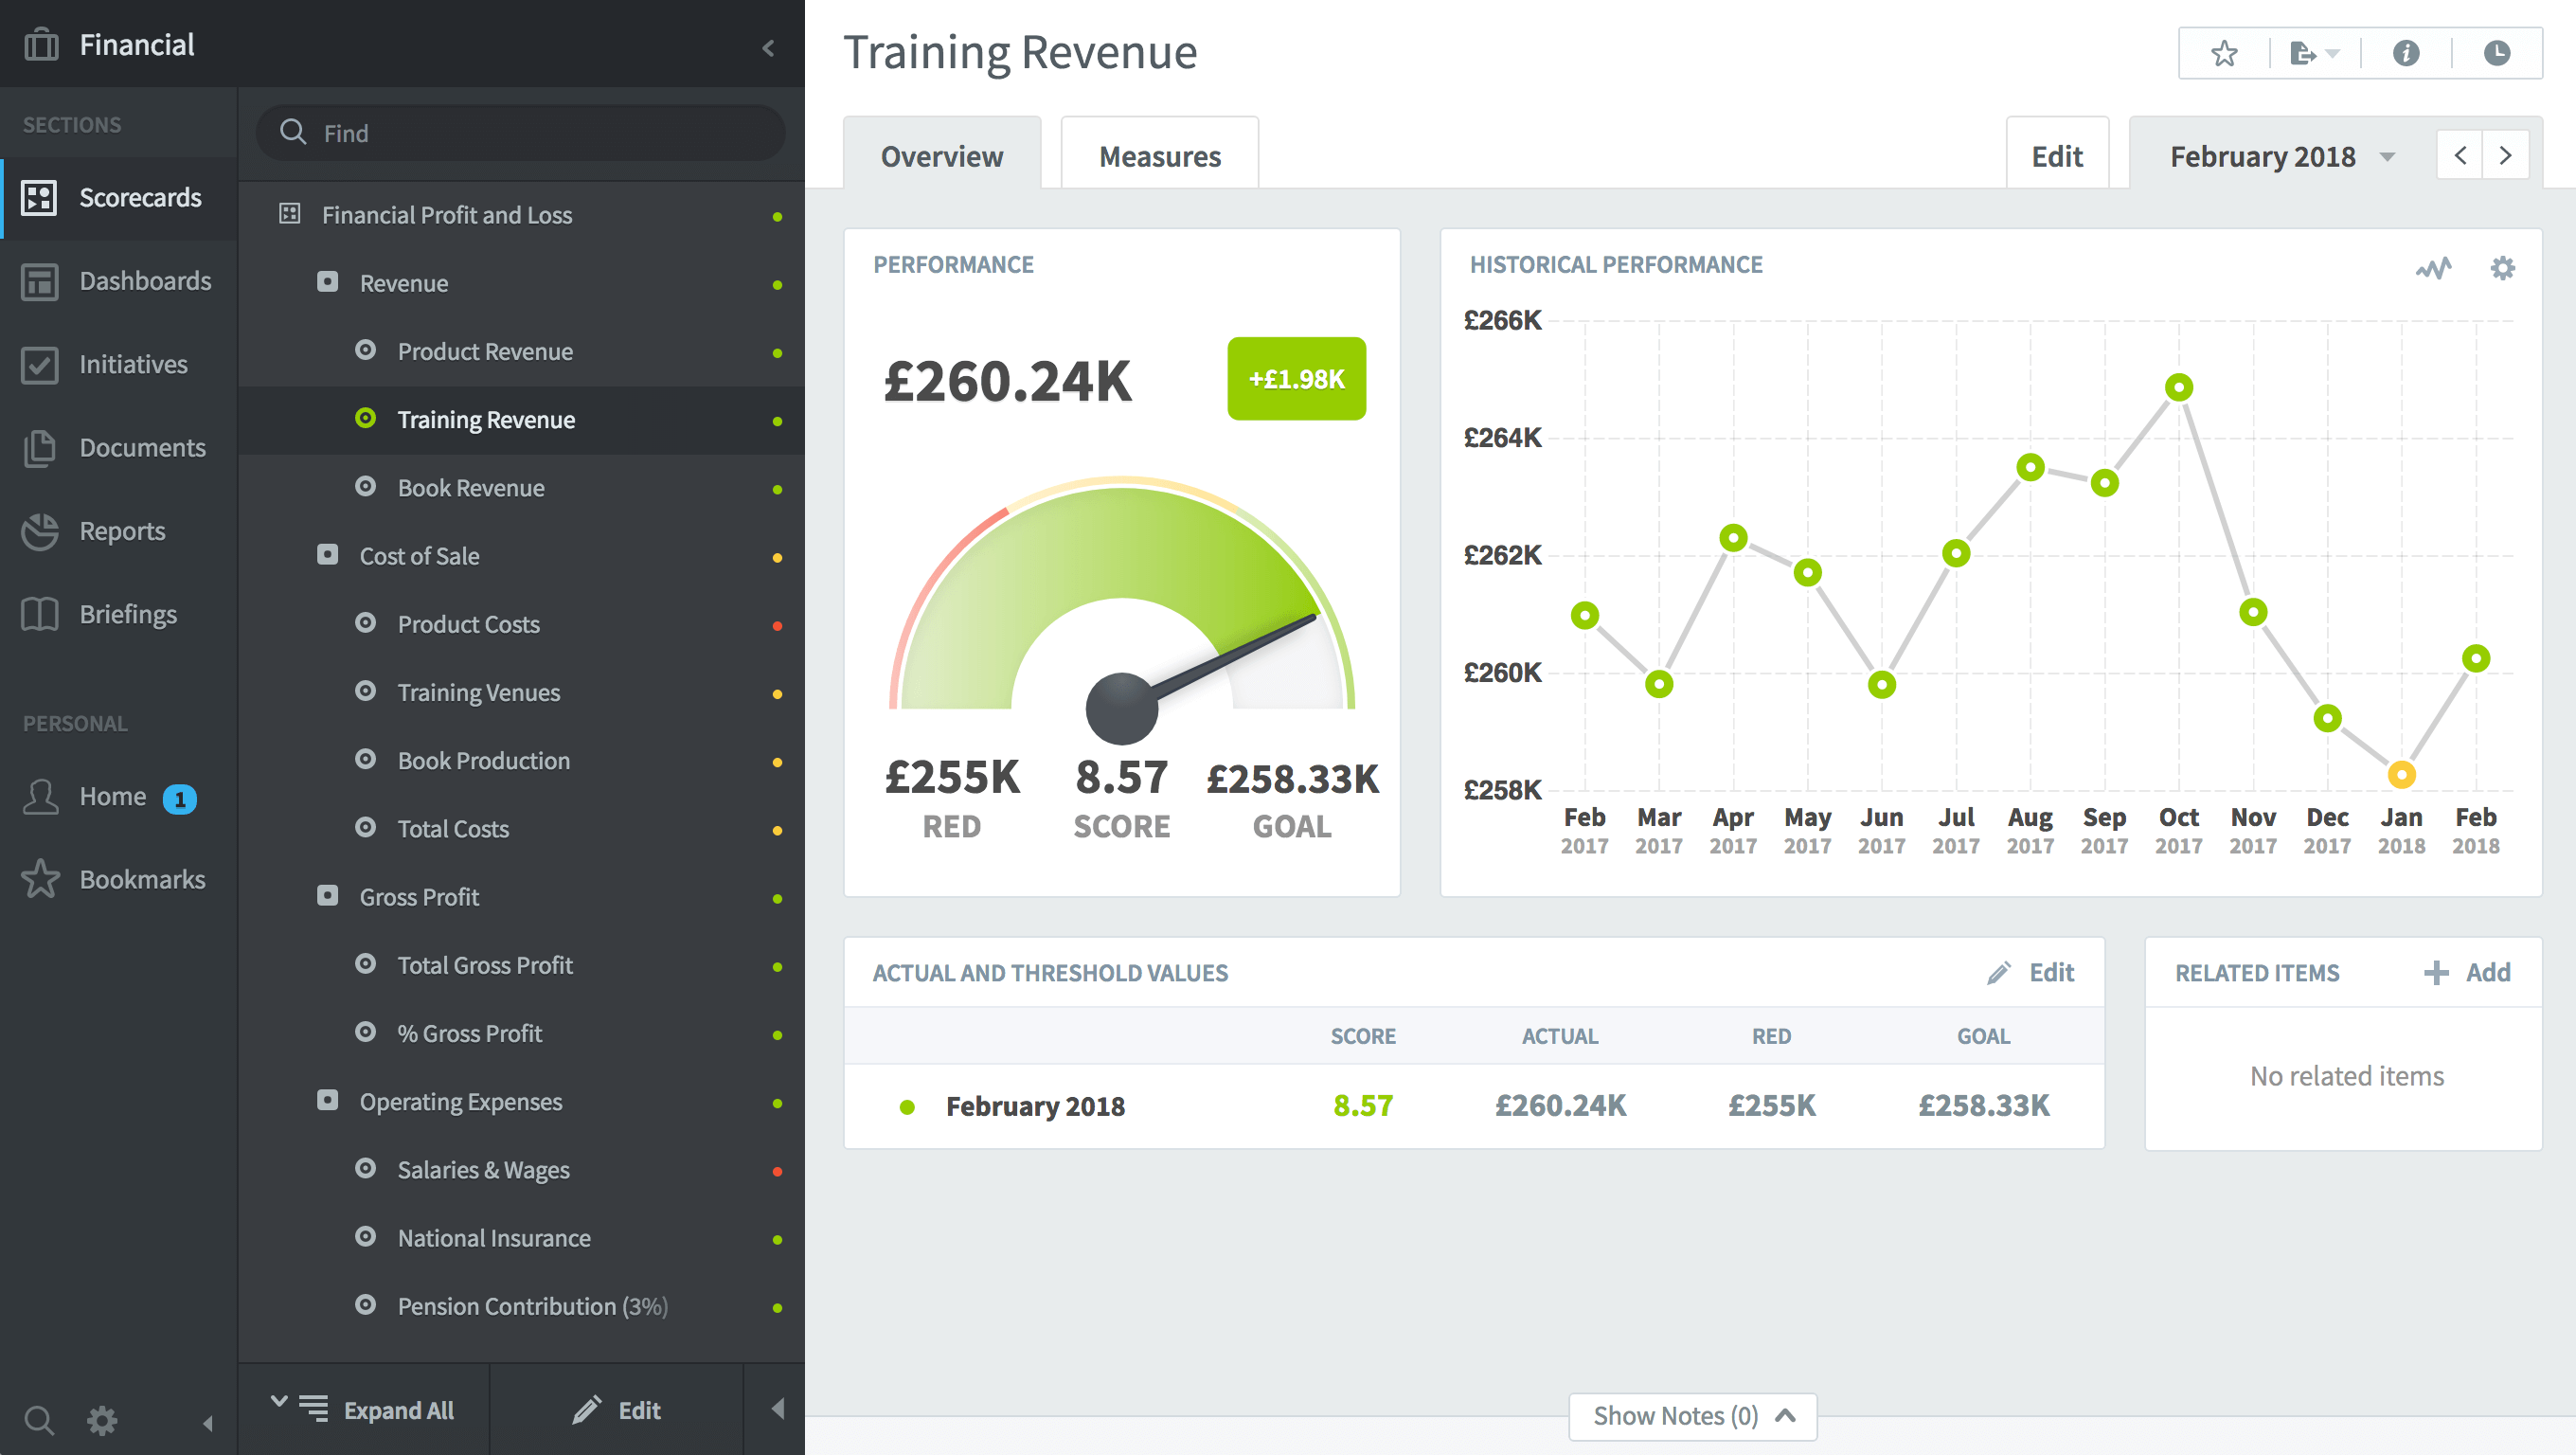
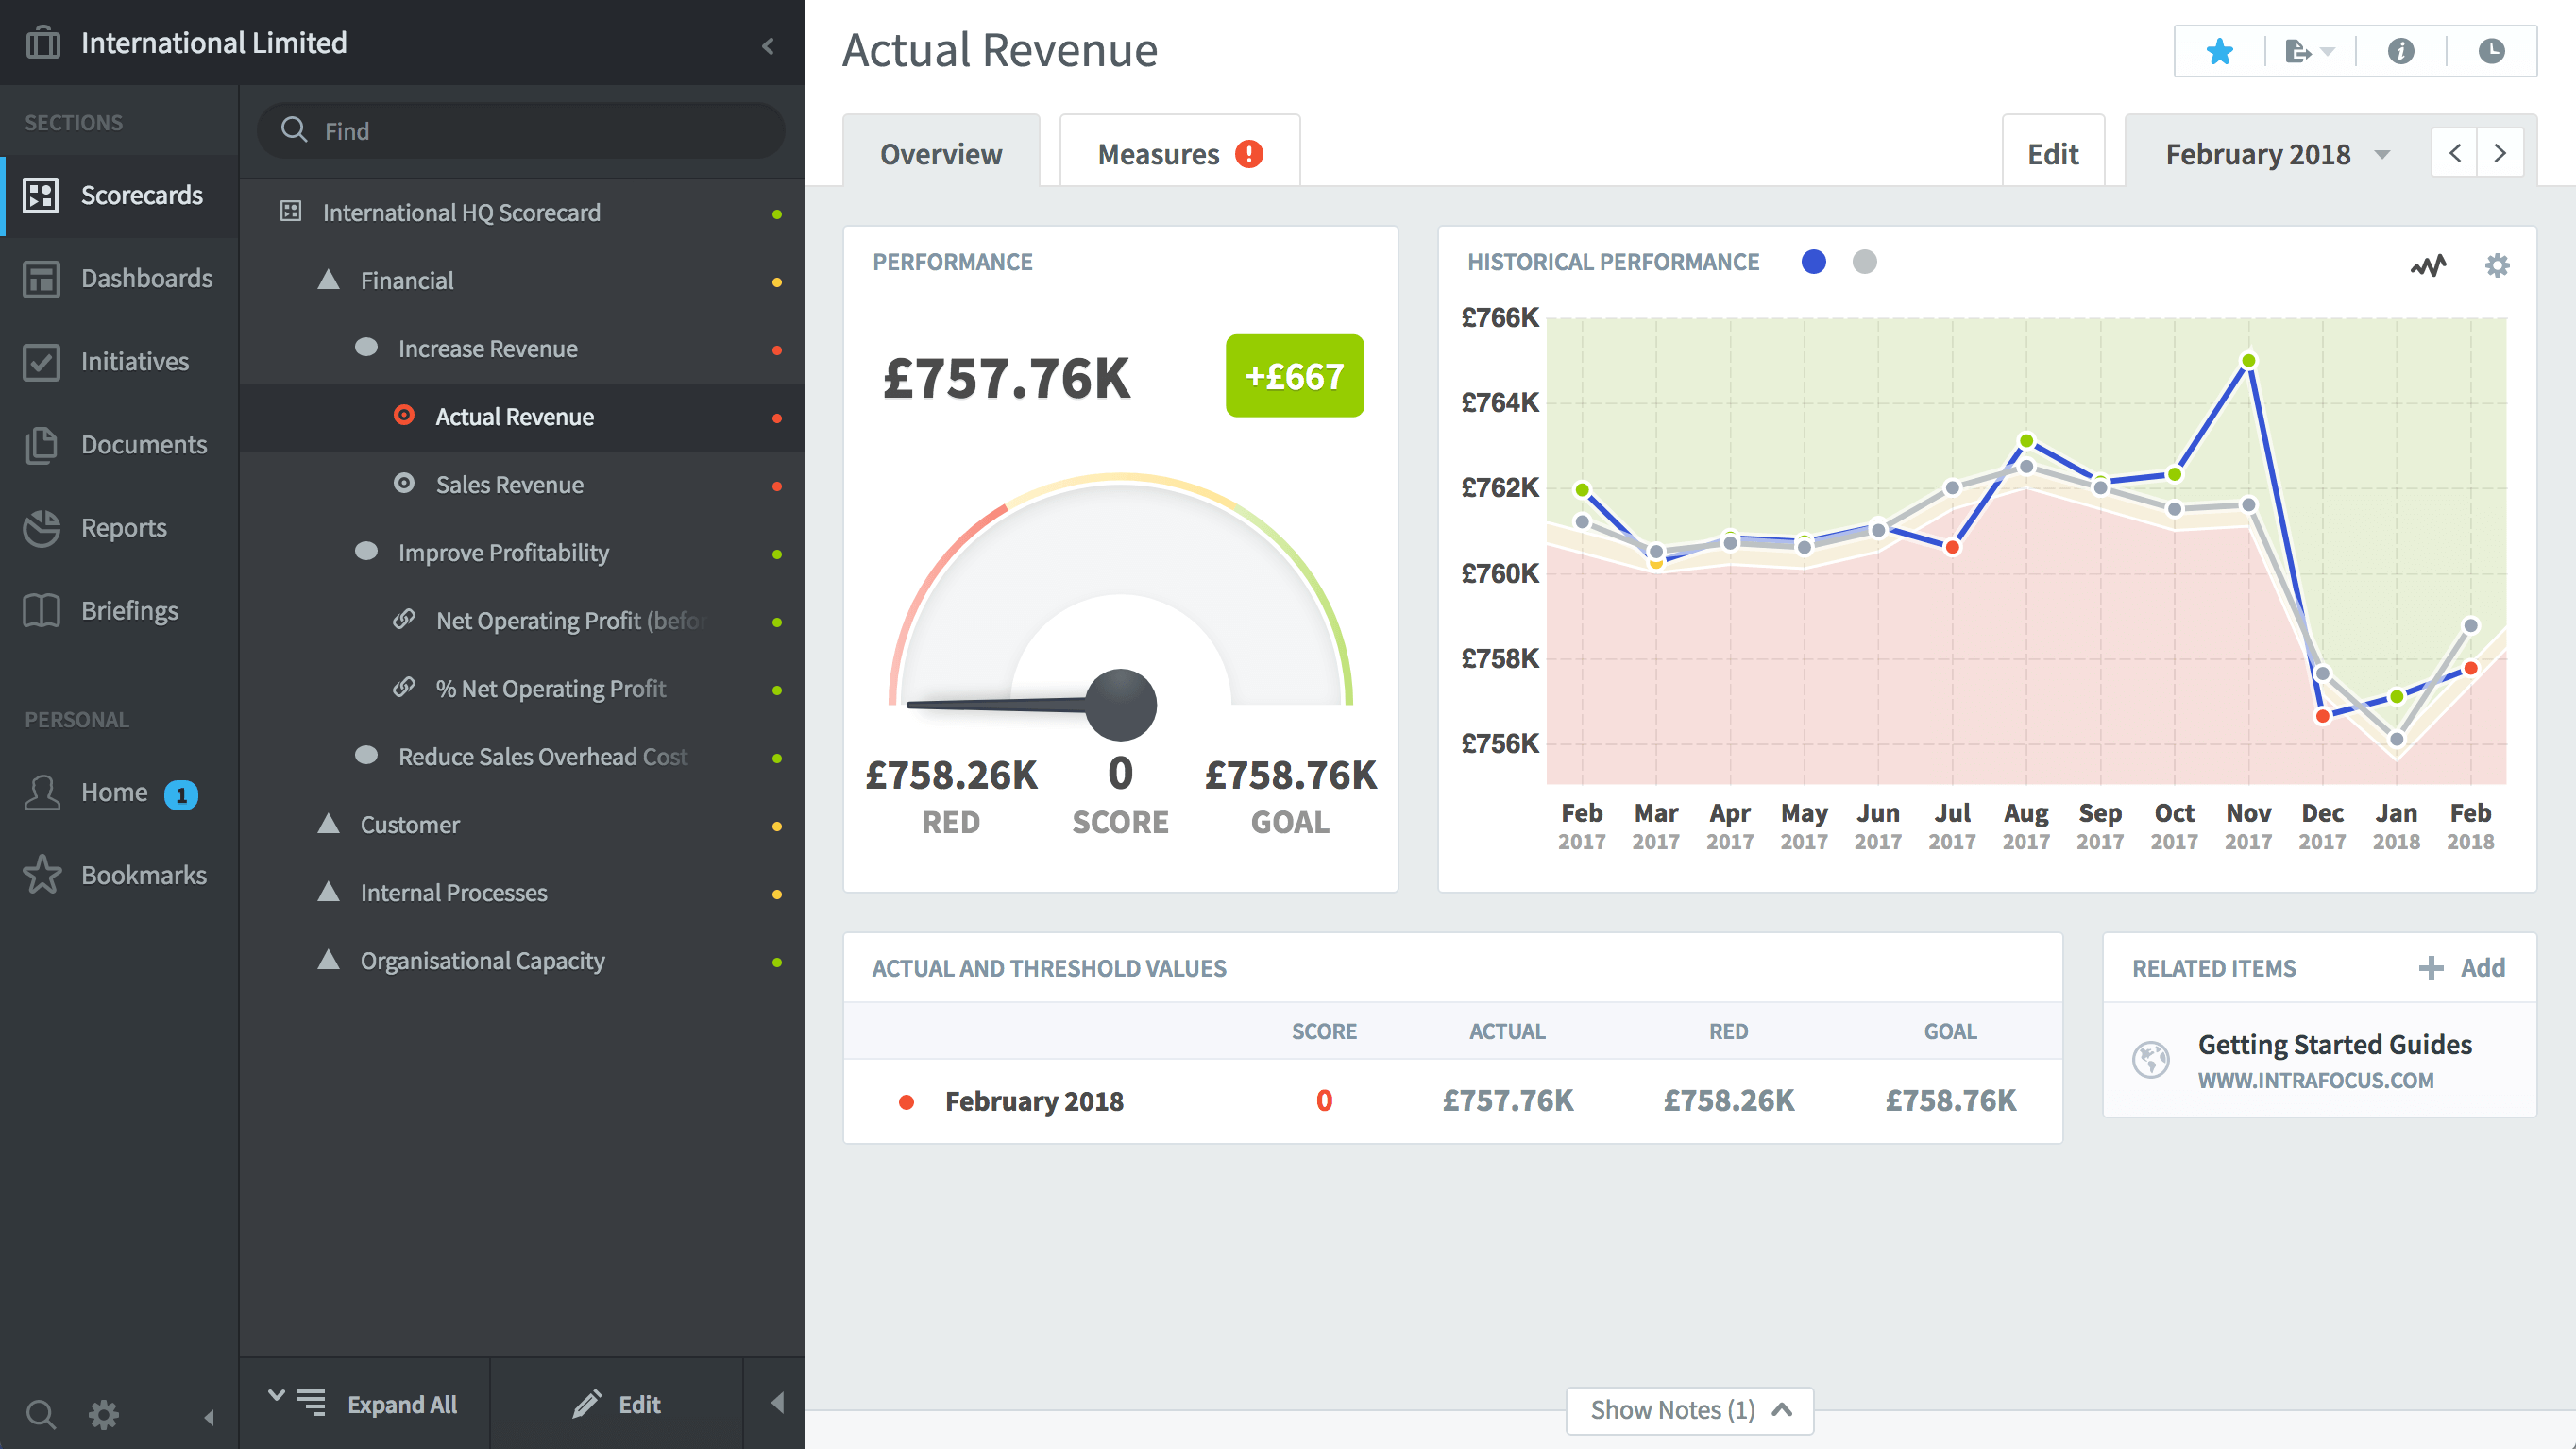
Example 2 – A Profit and Loss Scorecard
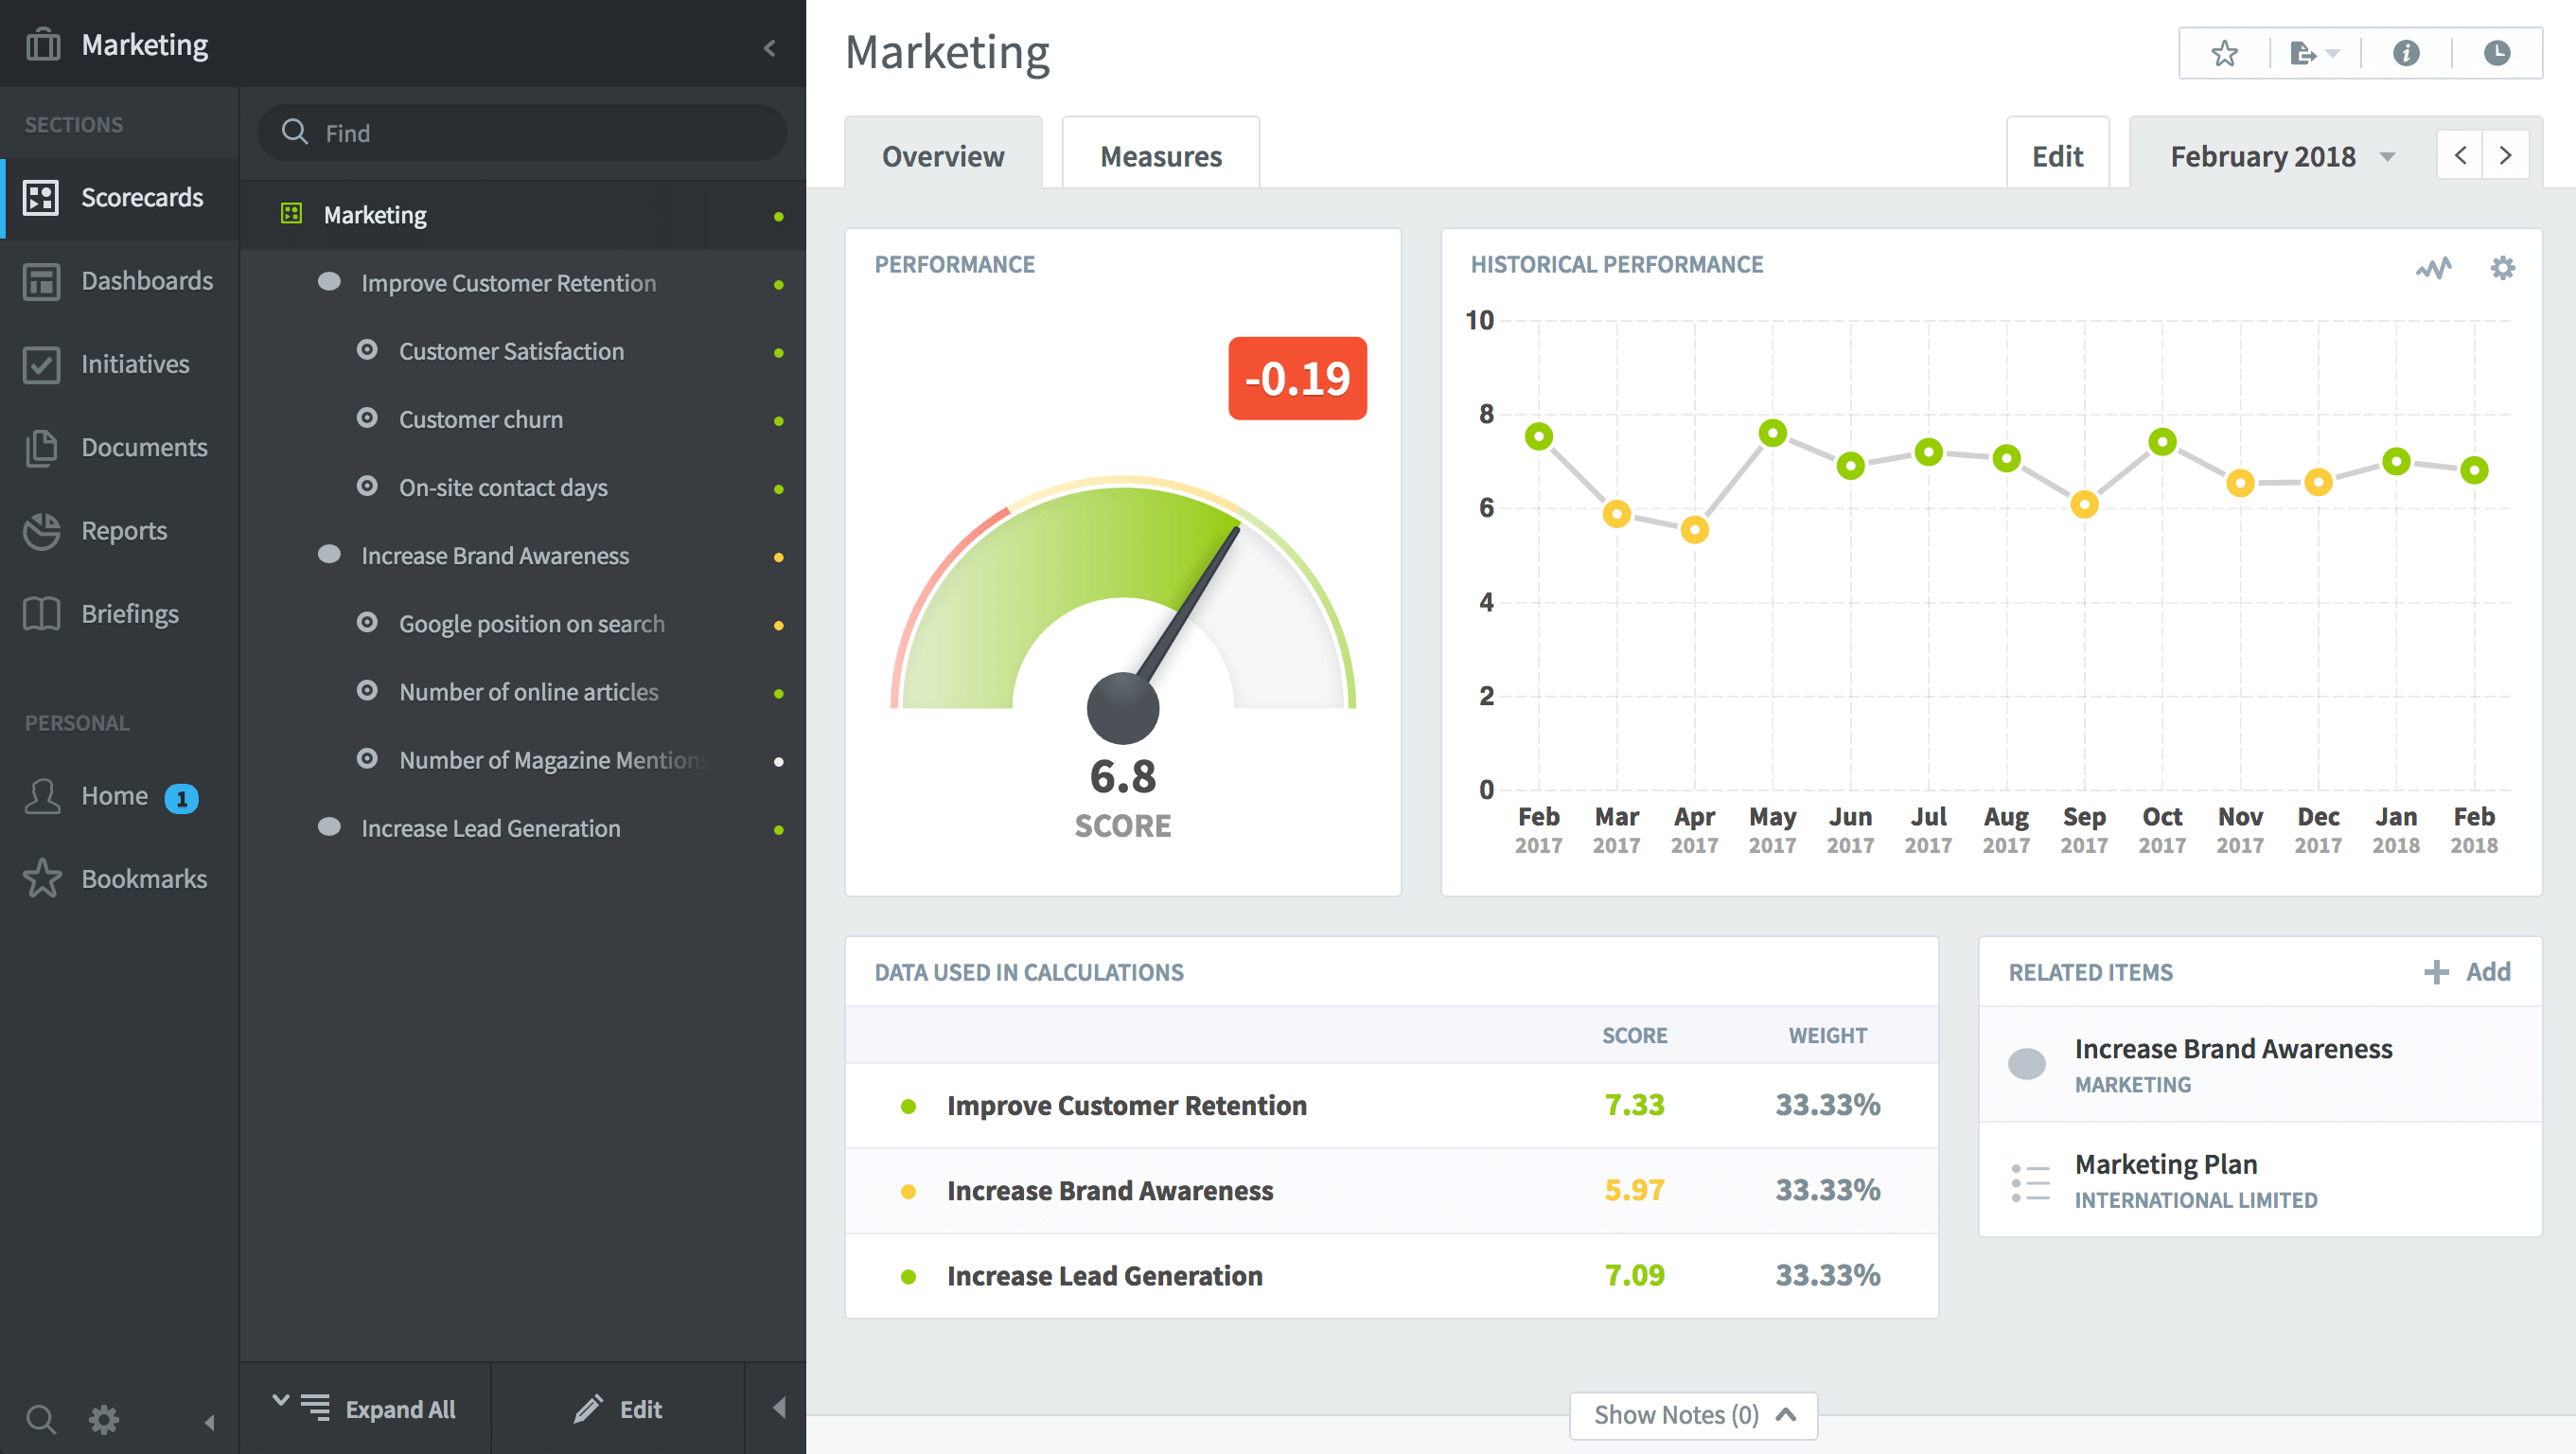
Example 3 – A Marketing Objectives Scorecard
Defining Measures/KPIs
Creating the Scorecard structure in the application is easy, it is a point-and-click activity where names can be given to the ‘containers’ of information, that is, the Themes, Key Performance Areas, Perspectives and Objectives. Within the containers, the most important element can be defined; the Measure/KPI.
This requires a great deal of thought. In the first instance, it is critical to ensure you are not measuring for measurement’s sake. Every Measure/KPI must be useful in its own right. Stacey Barr the world-renowned performance measure specialist writes in her blog that one of the most asked questions about KPIs is “How do I find the Right Measures/KPIs?” The answer to this question is not simple. In fact, it is the wrong question to ask. The first question that should be asked is: What process do I have in place to measure business performance? If you do not have a process in place, then you will have no structure and probably will be listening to the people who shout the loudest! There are industry-standard approaches available including PuMP from Stacey Barr, and The Balanced Scorecard from The Balanced Scorecard Institute. When you have decided which process to follow, then they will all recommend that Measures/KPIs should be built in a specific way.
This is where QuickScore or Scoreboard can really help. Measures/KPIs are created using a pre-defined structure that looks like this:
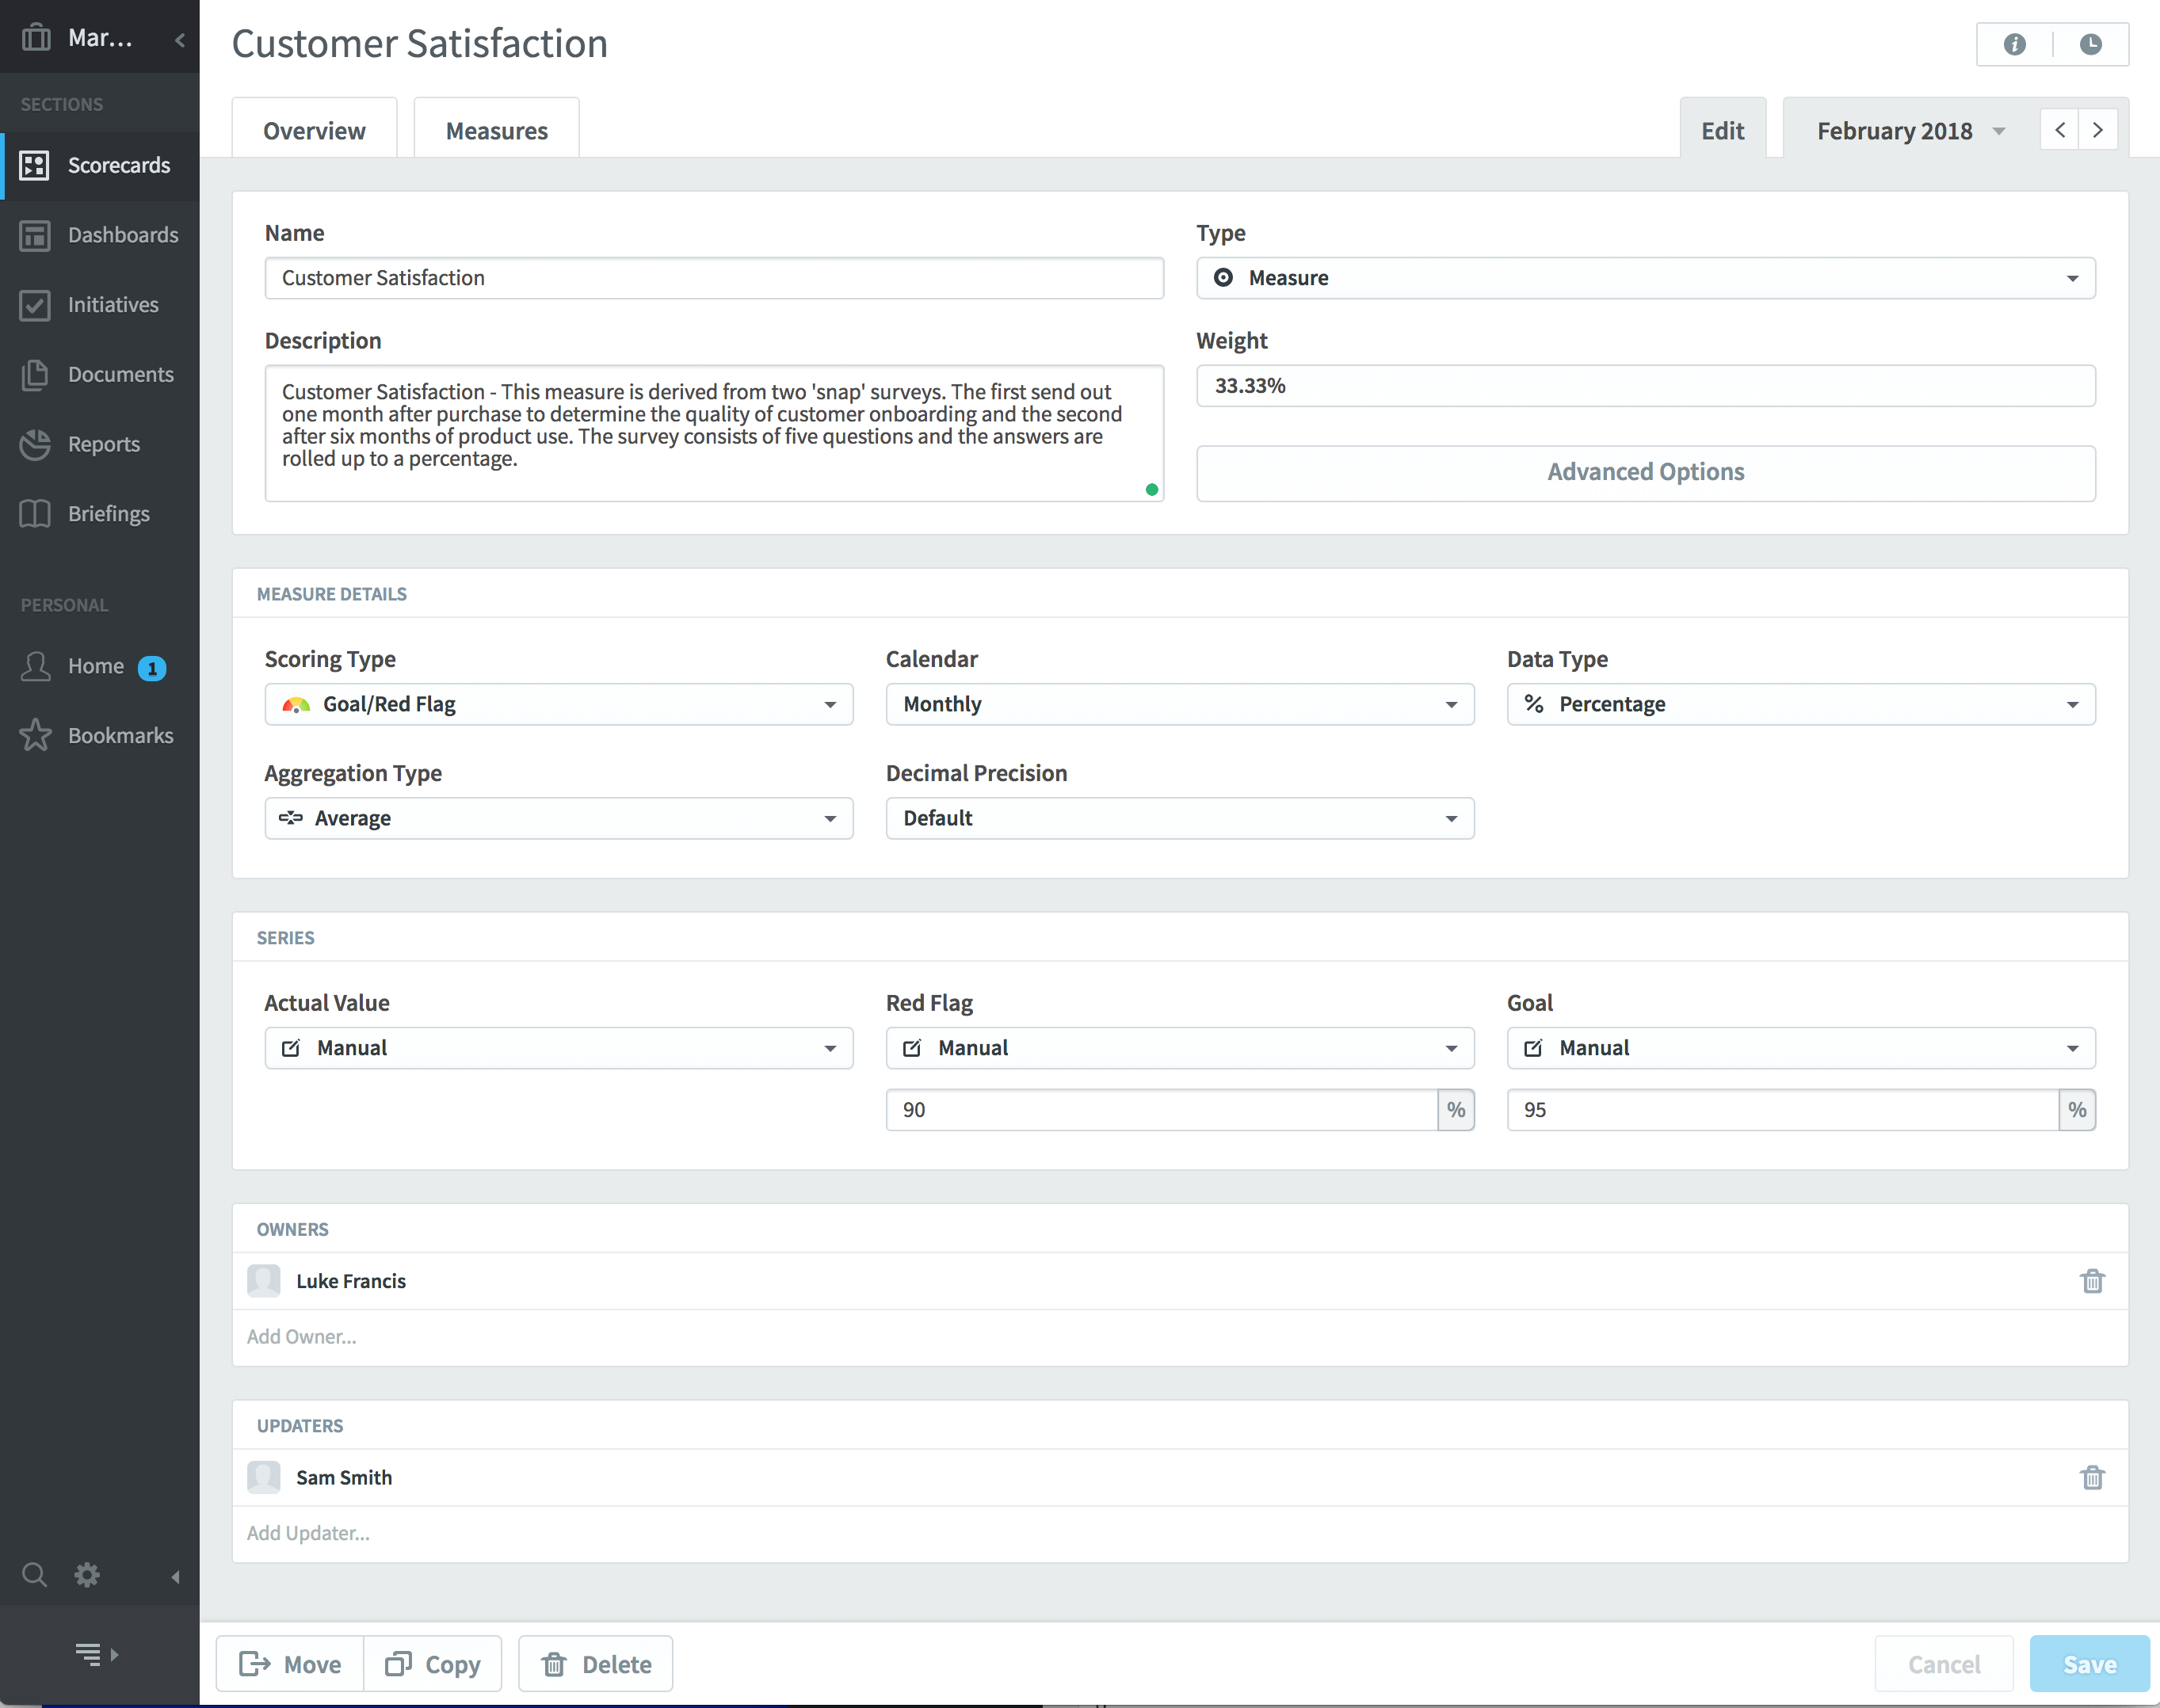
Here we can see that the person building the Measure/KPI is led through the process and asked to enter all of the information required for the specific Measure/KPI. This starts with the Name, Description and Type. The description is optional, but we would recommend that descriptions are always added as they prove to be invaluable in reviews when questions are asked about the data source.
The second panel looks at the Measure/KPI details. This Scoring Type is the most important element in this section. There are eleven different scoring types, however, the Goal/Red Flag (Red, Amber, Green) is the default and the one used more than any other type. Other types include; Four-Colour, Two-Colour, Stabilize, Yes/No and Unscored. They can be used for specialist measurements such as training budgets where a two colour stabilise (Red, Green, Red) might be used to ensure a budget is spent but not over-spent.
The third panel, Series, is often the most misunderstood element in business performance management. Every Measure/KPI needs to have defined Thresholds, that is, when the Measure/KPI turns Green and when it turns Red. In the example above, a value of 90% has been set as the Red Flag (Red) and a value of 95% has been set for the Goal (Green). Red flag and goal values are essential in a business performance management system. They allow the application to create a Score for percentage, currency, numeric and Yes/No values. The score can then be used to make a comparison between normalised Measure/KPI values and to roll-up scores to upper-levels.
Finally, in Owners and Updaters, people can be allocated to each Measure/KPI. Ownership is essential. Ownership means an individual is responsible and accountable for a Measure/KPI. The Updater can be the same person as the Owner, but often this is not the case. The person that collects and records the data, may not be responsible or accountable for the data.
There are other features that need to be explored in Measure/KPI definition, not least of which is using calculations to reference other data within the scorecard. This is an advanced feature and will be dealt with in the next article in this series.
If you would like more information on QuickScore or Scoreboard or how to create a meaningful scorecard, please be sure to visit other areas of this website.

