

Red, Amber, Green Reporting
A Key Performance Indicator (KPI) is meaningless unless you can compare its value to something else. Without comparison, it is impossible to say if the value is good, bad or indifferent. We ofter turn to a Red, Amber Green, notation to help with this process.
The comparator could be a target based on previous performance, a notional future performance, an industry benchmark, or even a made-up value. Whatever the target, it needs to be reasonable and achievable.
Financial measures
When looking at financial measures, targets are well understood; we often look at a ‘variance’ to an expected result. For example, if an expected monthly revenue is £325k and the actual income recorded is £309k, the variance would be -£16k. This may or may not be a cause for concern. It would depend on what was considered an acceptable variation to the target. The variances above and below the target are called thresholds.
For a KPI to be valid, you must define the acceptable and unacceptable thresholds.
Threshold models
There are several threshold models available. For the purpose of illustration, let’s look at the most common: Red Amber Green (RAG). In the RAG model, there are two threshold points:
- When the KPI should turn Green
- When the KPI should turn Red
There are no hard and fast rules to the meanings attributed to each of the coloured areas, but generally, they tend to be:
- Green – an acceptable result; we are on target
- Amber – there may be a problem; we should investigate
- Red – an unacceptable result; there is a problem that needs rectification
By using an example ( for instance: Sales Conversion Rate), we can illustrate as follows:
- Green – 3.5% or more
- Red – 3.0% or less
After entering these thresholds into a performance management system like Spider Impact, the result might look like this:
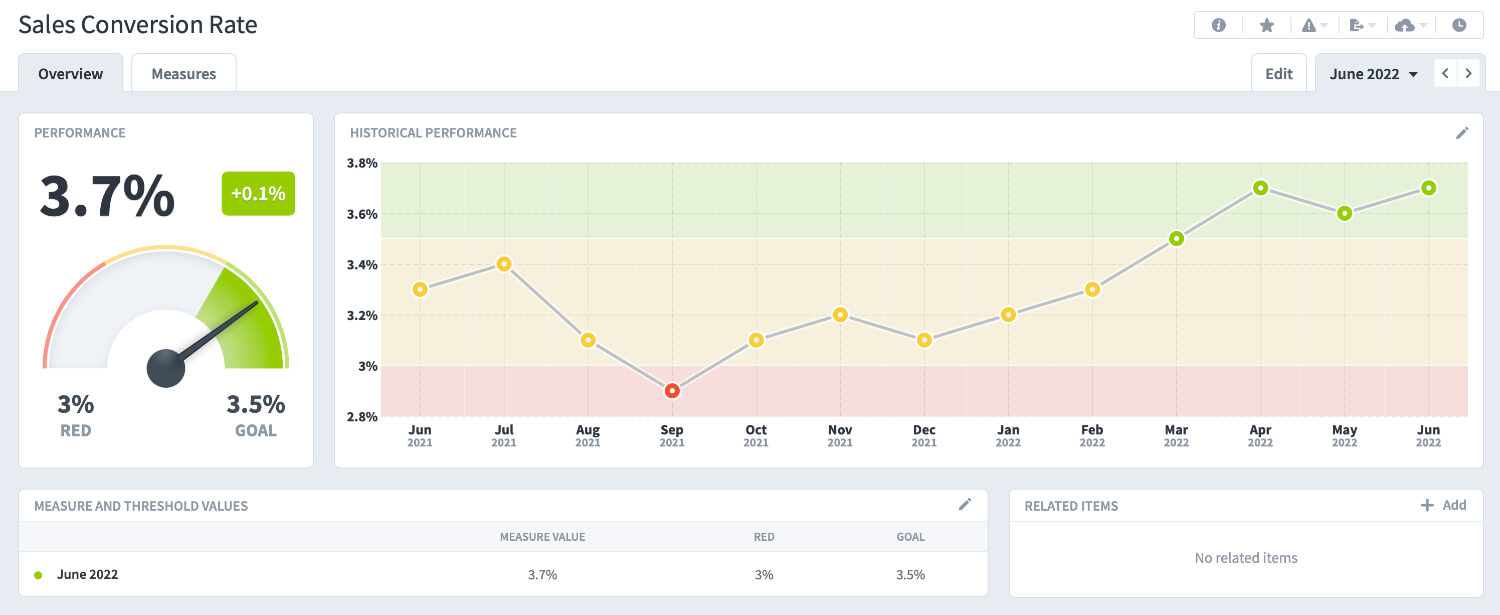
As can be seen, by setting threshold values, the viewer can instantly and very graphically see the current situation and, equally importantly, the history leading to this point.
Other threshold models
Out of the numerous threshold models, two more need consideration. The first is Red Amber Green Blue, and the second is Red Green Red.
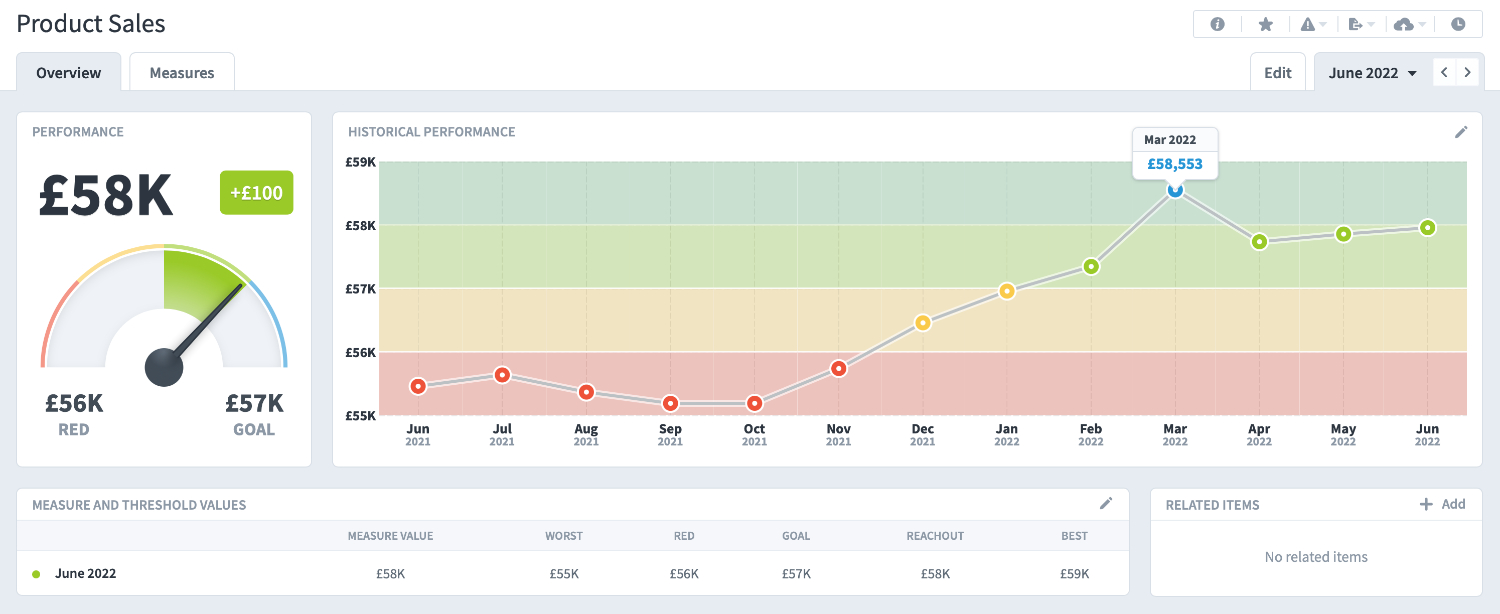
Often there is a need to understand an ‘over-achieved’ status better. This is particularly true in sales, where bonuses may be based on not only achieving a target but also over-achieving it. In this case, you can use an extension of the RAG model. The Red Amber Green Blue variant. Here, it is customary to set five thresholds:
- The lowest acceptable result
- When the KPI should turn Red
- When the KPI should turn Green
- When the KPI should turn Blue
- The highest acceptable (or capped) result
This way, an over-achieved status can be monitored and managed. Most systems will also put a ‘cap’ on the highest acceptable result. Again in sales, this may be desirable to avoid run-away bonus schemes. The result might look like this:
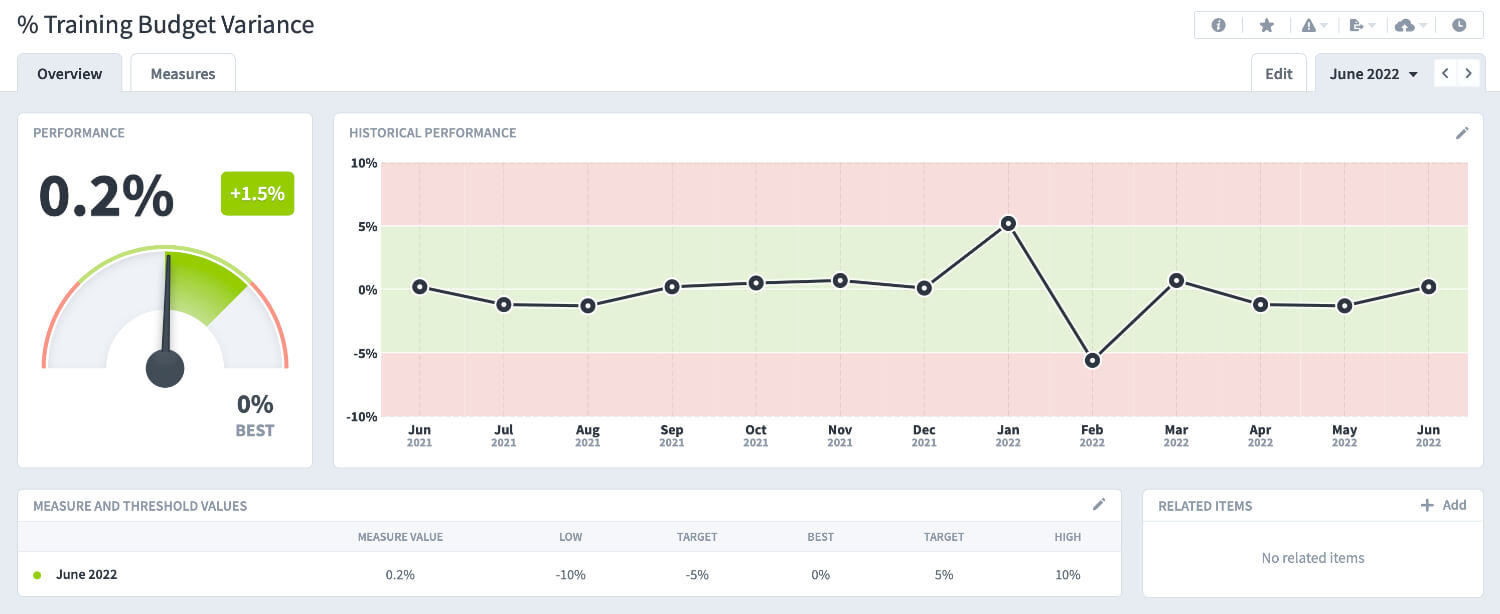
The third threshold example is the ‘stabilise’ KPI. Occasionally a KPI is deemed unacceptable if the result is either too high or too low. A good example is a training budget. In training, we want to spend to the budget but not exceed or go below the budget. In this case, we define the ‘best’ result and then determine acceptable and non-acceptable results below and above the best. For example, in a training budget, the result might look like this:
Developing your KPIs
Using a red, amber, and green system may seem to be a straightforward reporting methodology. As with any system, it has its pros and cons. Providing visual cues can be enormously helpful. But the same visual cues can cause wasted time and effort if they are not used sensibly. Any single ‘Red’ result should not be looked at in isolation. Instead, adjacent KPIs should be examined. And, of course, questions should be asked of the KPI owner. The red result in a single month may have been intentional. It is important to start the process properly. Creating meaningful KPIs is not a random ad-hoc activity. It should be a considered activity, planned and executed using a good business process.
You can find more information in our eBook: How to develop meaningful key performance indicators.

