
STRATEGIC PLANNING PROCESS
Step Seven - Automation
Don’t be fooled in to thinking you can manage your strategy with a spreadsheet!


Click on each step above for a full description
Automation
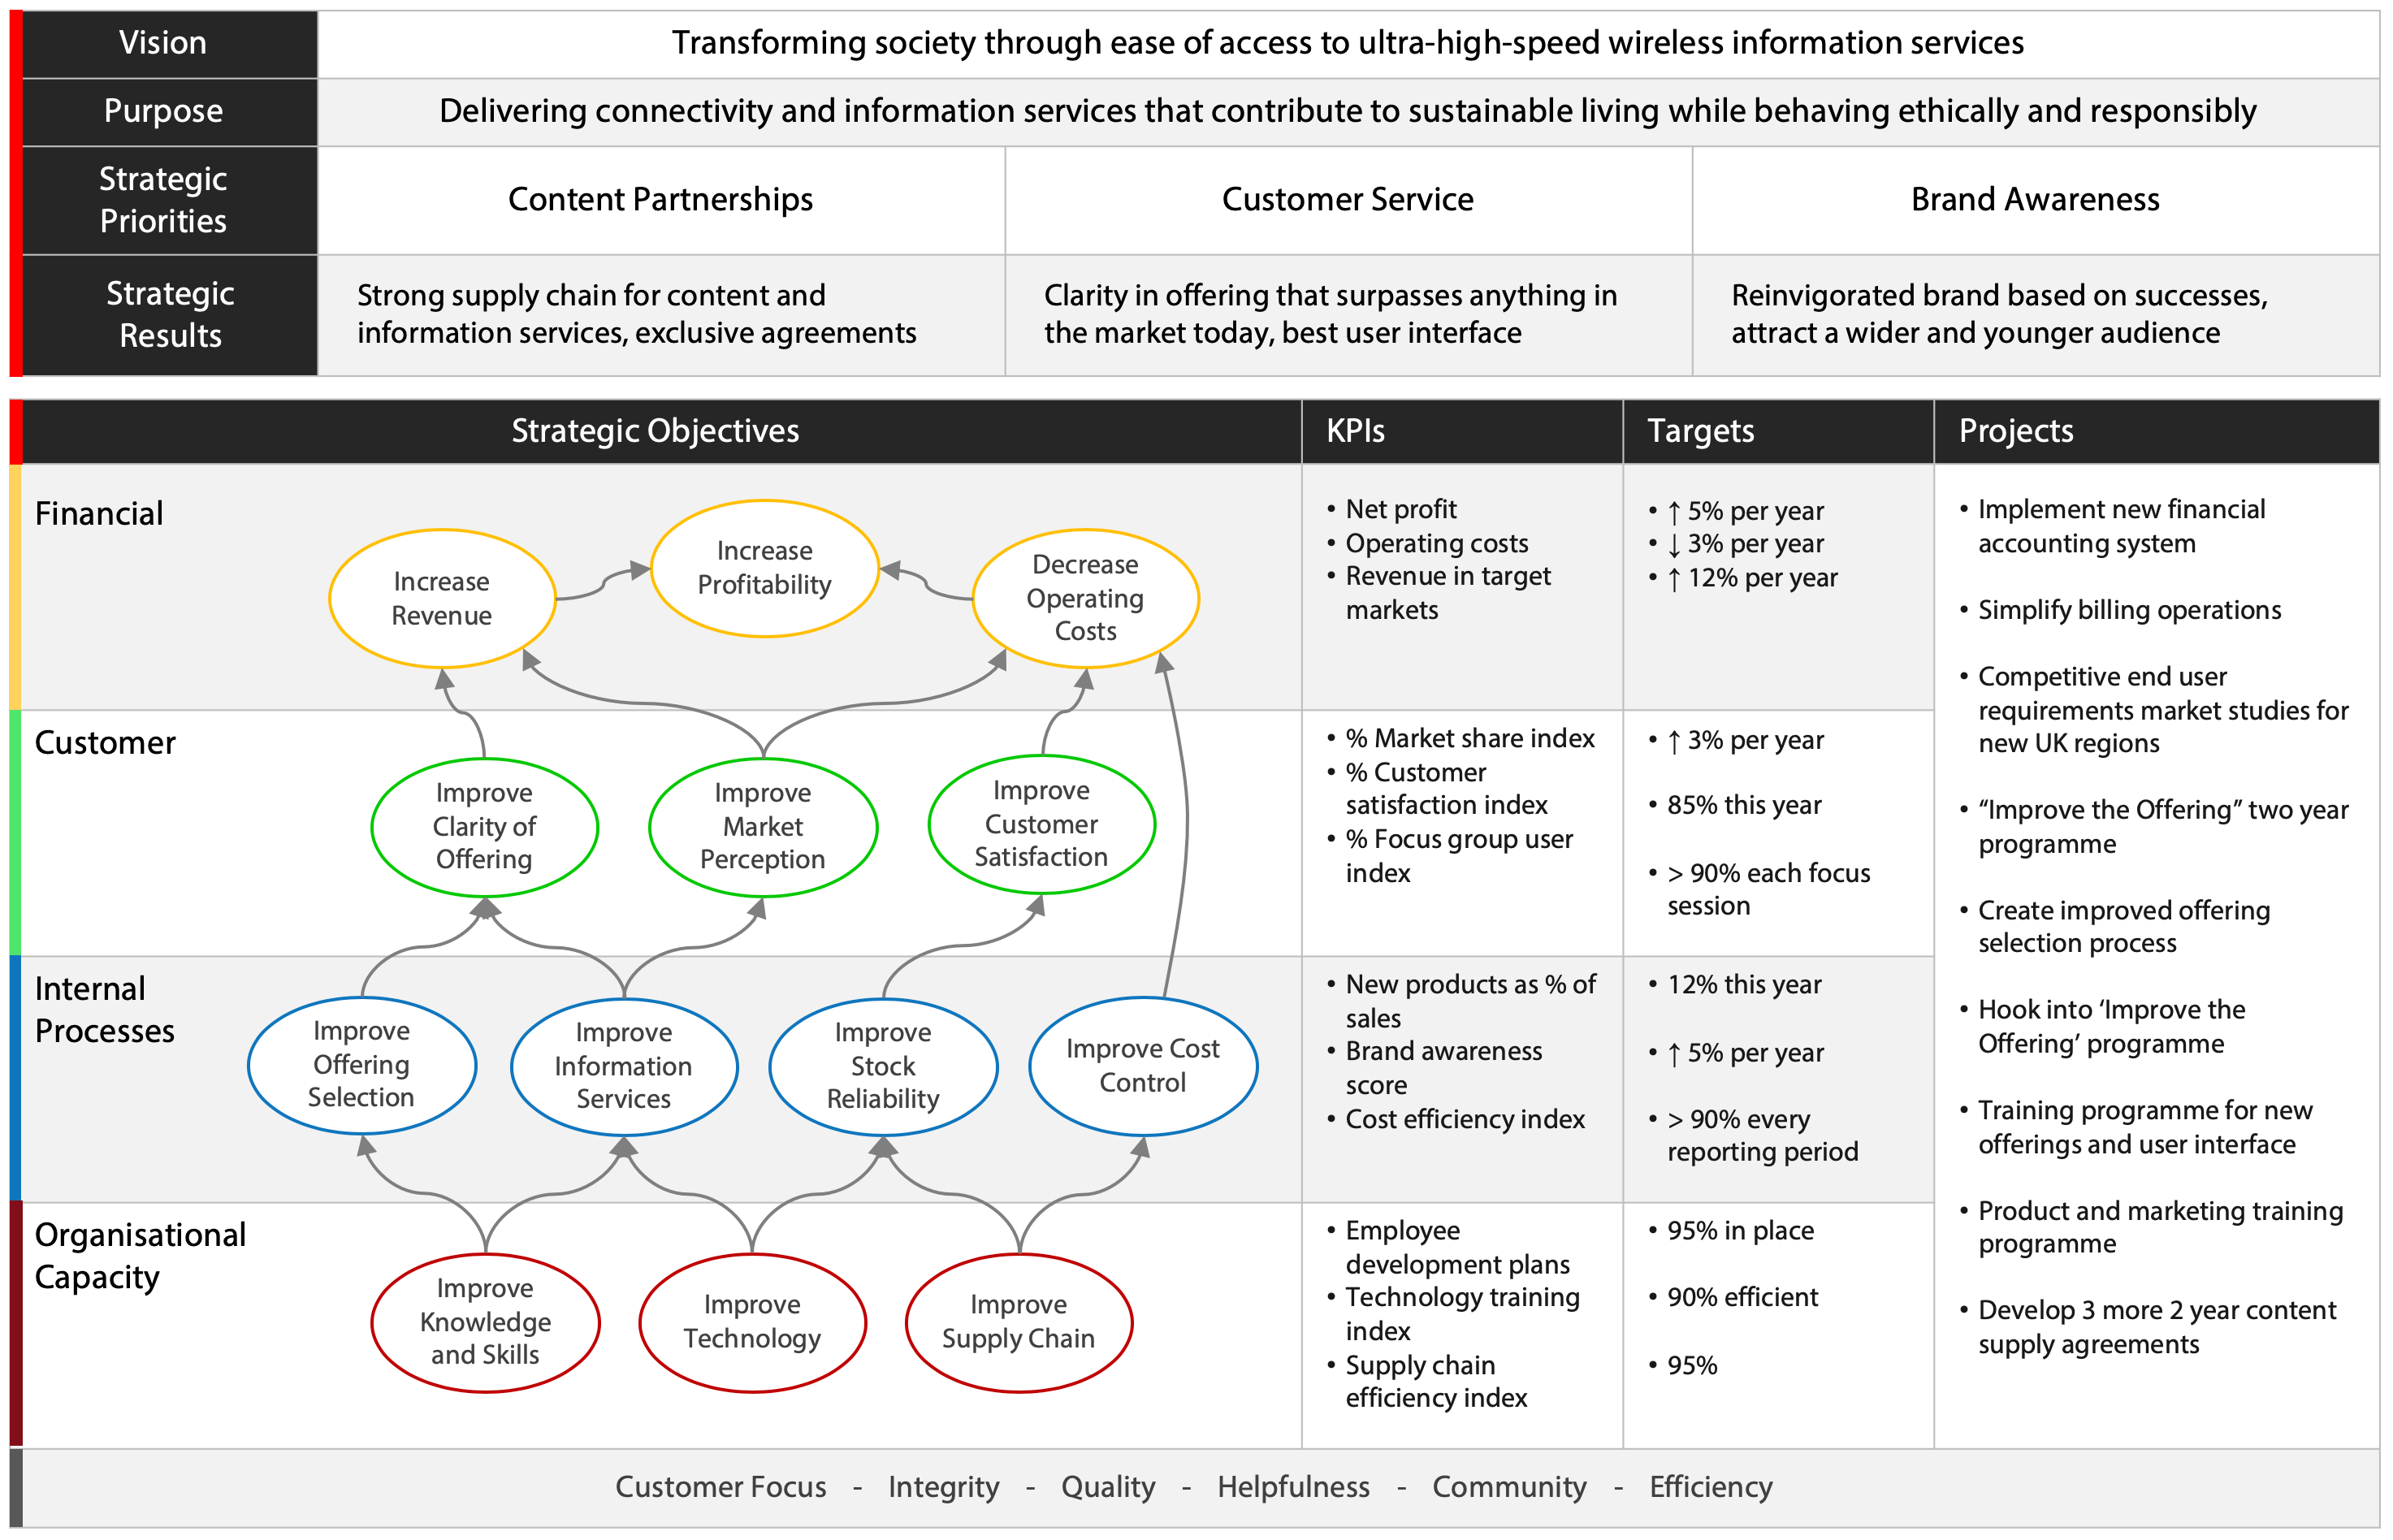
If you are serious about implementing your strategy effectively, then you need to build your vision, purpose, priorities, objectives, KPIs, targets and projects into a software system. Do not be fooled into thinking this can be achieved with spreadsheets and presentations.
If that is what you intend to do, then you need a strategic objective called ‘Improve our Strategic Process!”
Keeping control of your strategy can be a daunting task so you need to use a tool that will maintain the relationships between every element of your work. If you have not done so already, then select an appropriate software package. We recommend Spider Impact. If you need help in selecting a package then look at our Strategy Management Software Guide which provides some useful selection criteria and a template Request for Proposal (RFP).
Dashboards and Reports
Once you have set up a software system and added your strategic elements, you can then monitor progress by updating your KPIs and strategic projects. Over time you will have enough historical data to interpret the results. There are two phases to this activity, first to create a set of dashboards and reports from the data and second to interpret the results.
The purpose of reporting is to provide enough detail to enable an organisation to be managed effectively. The advantage of using an automated system is the reports are updated when any KPI value is changed. Care needs to be taken when designing a dashboard or report, the key question to be asked is:
- Who is the audience?
All data visualisation has to start with the audience in mind. A chief executive will want a very different view of a business as compared to an operations manager or a financial director. One-size will never fit all in dashboard creation.
Interpreting Results
Earlier we spent time looking at thresholds. One of the unfortunate by-products of defining thresholds is to reinforce a knee-jerk reaction when interpreting data. For example, when applying colour coding, as in the report above, the eye is immediately drawn to the red values. Where it might be worthwhile exploring strings of red instances, it is rarely worthwhile spending time on single red instance; it will never provide the whole story. We may have taken a step forward but cannot simply rely on a RAG status to enable decision making.
Why? Because businesses are complex entities, no single or identifiable cause can hold the key to a solution. Just because a KPI is 5% down on last month’s performance, is different to last year’s performance, or has gone below an artificially imposed threshold, does not automatically mean there is a problem.
Using thresholds only gives us what we need to undertake a point analysis of a KPI. Simply put, if the KPI moves from an acceptable position (green) towards an unacceptable position (red) then we might need to start a line of enquiry.
To get the most out of this workshop download the Strategic Planning Workbook, the Strategic Plan Summary one-page presentation and the Strategic Plan Template from the Intrafocus website.
Click on the image to enlarge