My5 – Upload structure from a spreadsheet
Upload dashboard and KPI structure settings from a spreadsheet
Sample Spreadsheets:
WARNING: This function will overwrite any existing dashboard and KPI settings. Only use this function to build your system from scratch or rebuild an existing system.
<<< Watch the Video
First, you need to prepare a spreadsheet.
We suggest you perform this operation from a Mac or PC. You can use your phone, but you might find it easier to manipulate the spreadsheet on a Mac or PC!
Click on the setting cog at the top-right of the screen and select Import Spreadsheets.
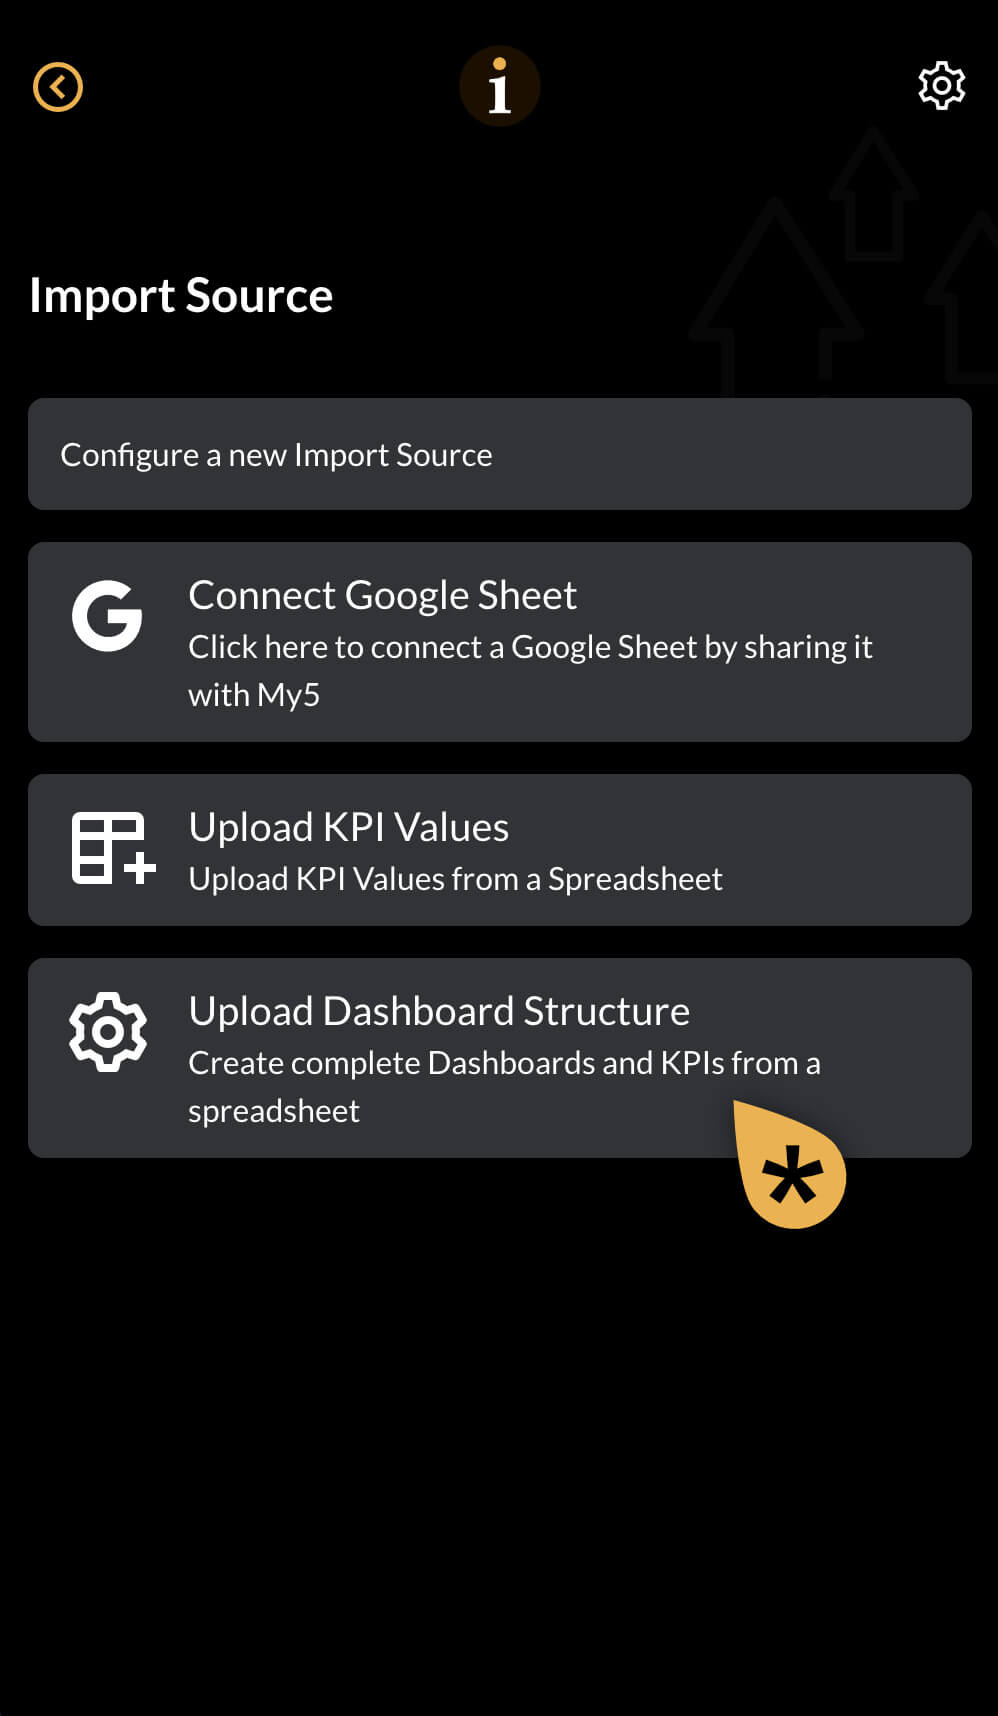
Import source
Select the source, click on the Upload Dashboard Structure panel.
Go to the next step.
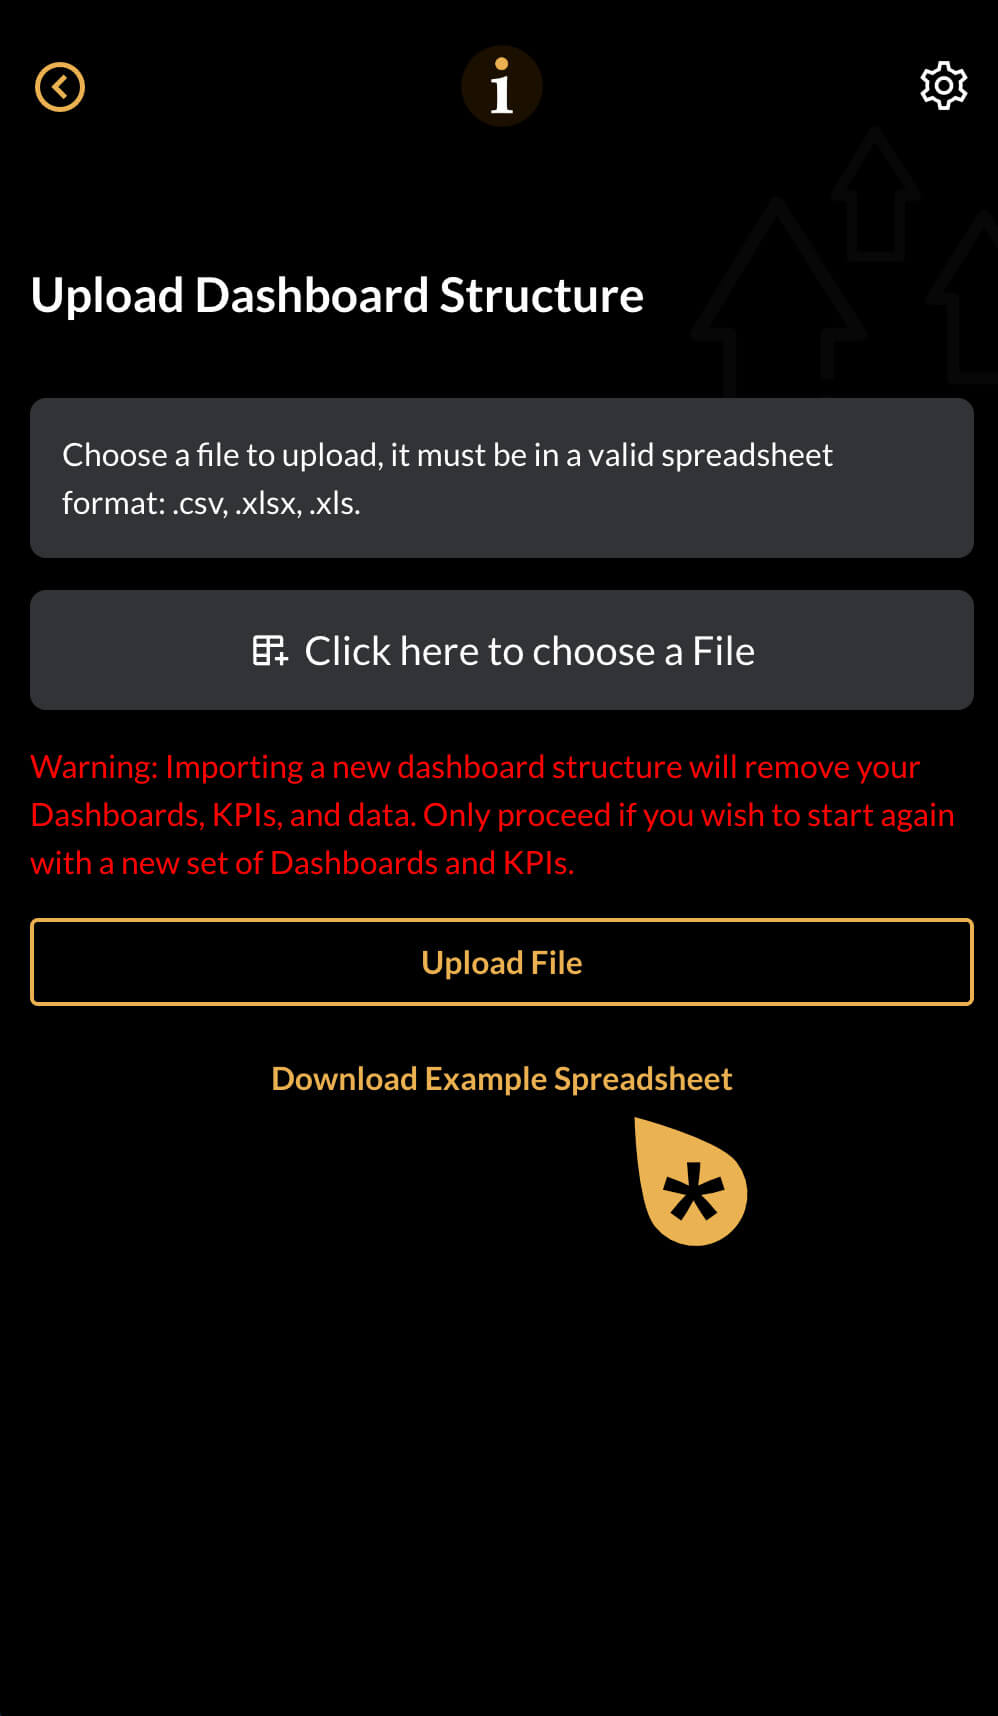
Download the sample spreadsheet
When uploading a spreadsheet it has to be in the correct format.
Click on Download Example Spreadsheet to obtain a copy of a spreadsheet in the correct format. You can use this as a template for your upload.
Go to the next step.
Sample spreadsheet
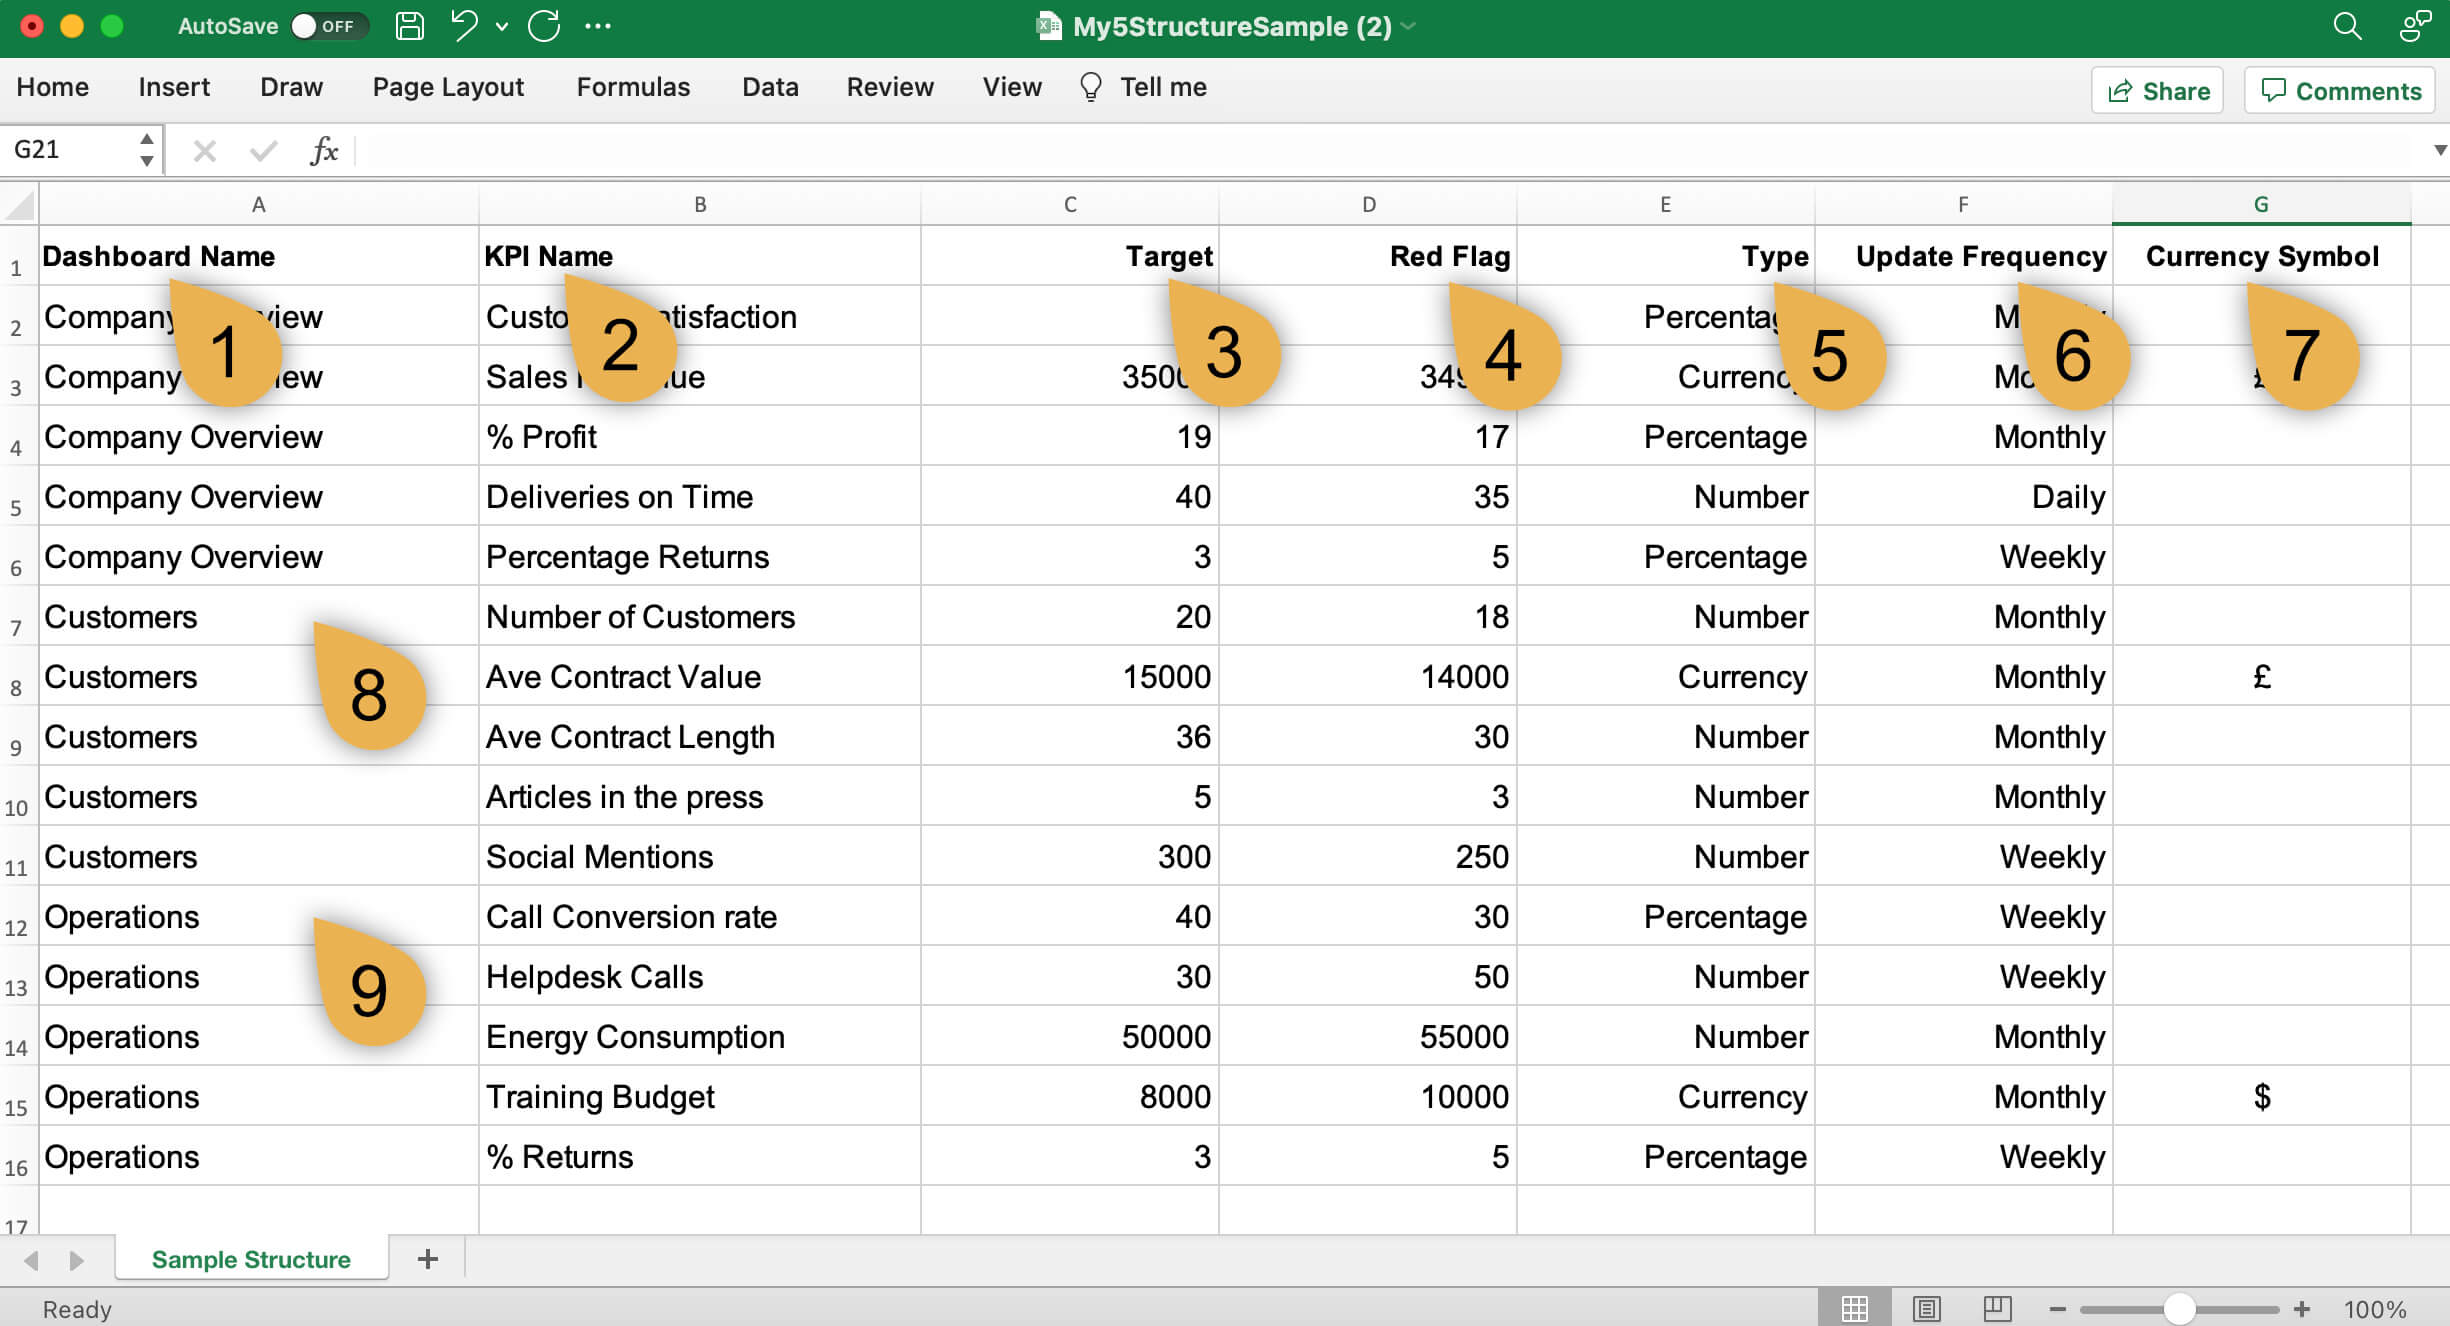
The Upload Dashboard Structure spreadsheet format is fixed. The column names data that can be included are as follows:
1. Dashboard Name – You can call your dashboards anything up to a maximum of 20 characters. Notice that the dashboard name has to appear in every row where you have a KPI as shown with labels 8 and 9. You can have a maximum of 5 dashboards. In this example, we have 3.
2. KPI Name – Your KPIs can have any name up to a maximum of 22 characters. Try to keep the names meaningful and unique. You can have a maximum of 25 KPIs, 5 per dashboard.
3. Target – The target is the point at which your KPI will turn green. This can be an increasing target, for example, Deliveries on Time. Or a decreasing target, for example, Percentage Returns. Increasing or decreasing is determined by the value of the Red Flag.
4. Red Flag – The red flag is the point at which your KPI will turn Red. If the value of your KPI is between the Target and the Red Flag, it will turn amber.
Important Note: do not use signs in the spreadsheet, for example, %. The sign is determined by the KPI Type.
5. Type – The KPI can be a Number, Percentage or Currency. If you select a currency, you will need to add a currency symbol in the Currency Symbol column.
6. Update Frequency – You can update KPI actual values as many times as you like. The value in the update frequency column will determine which KPI value to display. For example, if the update frequency is set to Monthly, the display will default to the last day of the month and show the last KPI value added during a given month. Suppose the update frequency is set to Weekly. In that case, the display will default to the last Saturday in the week and display the last value added during any given week.
7. Currency Symbol – If you have selected Type as Currency, then you can add the currency symbol here. The app will make every effort to display your currency symbol correctly.
8 & 9. Dashboard Names – to remind you, dashboard names have to be present in every row where you have a KPI.
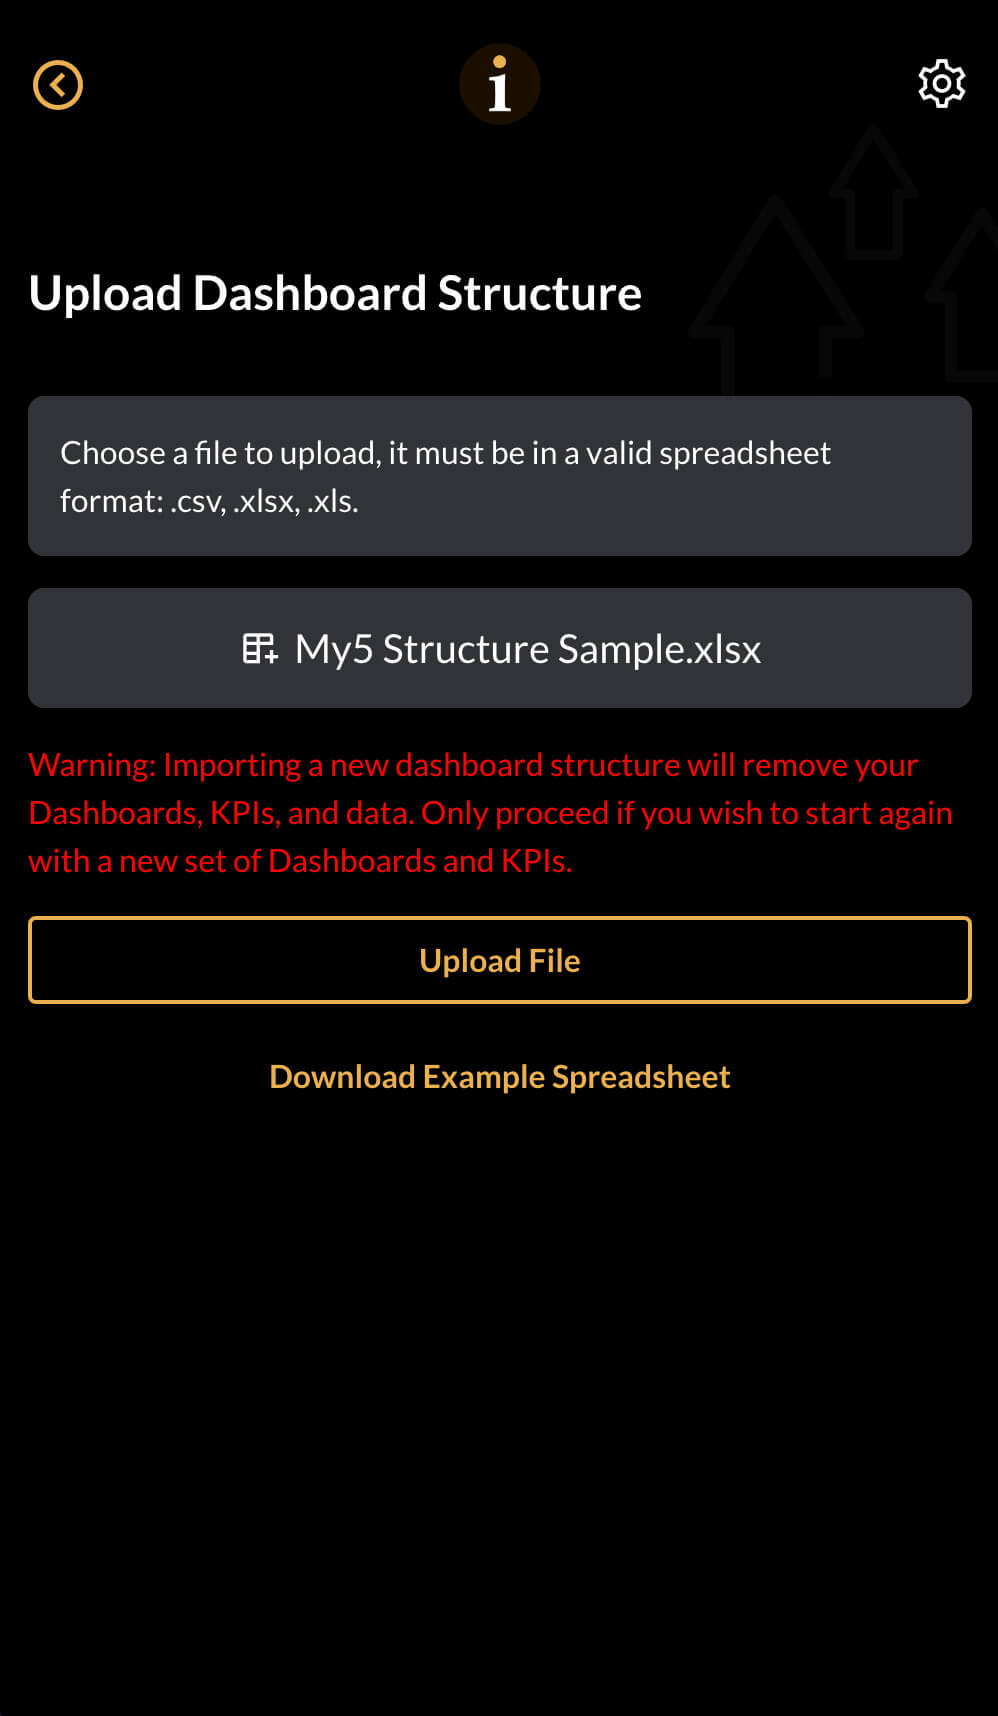
Choose your file
Once you have created your Dashboard Structure file, please save it to an accessible place.
Go back to the Upload Dashboard Structure screen, click on Click here to choose a file and select the file you have just created.
Click on Upload File
You will be given a final warning!
Don’t forget, this operation will blitz your existing system. It will not be recoverable. If you want to continue, click on ‘I understand, proceed with the import’ and go to the next step.
Return to dashboard
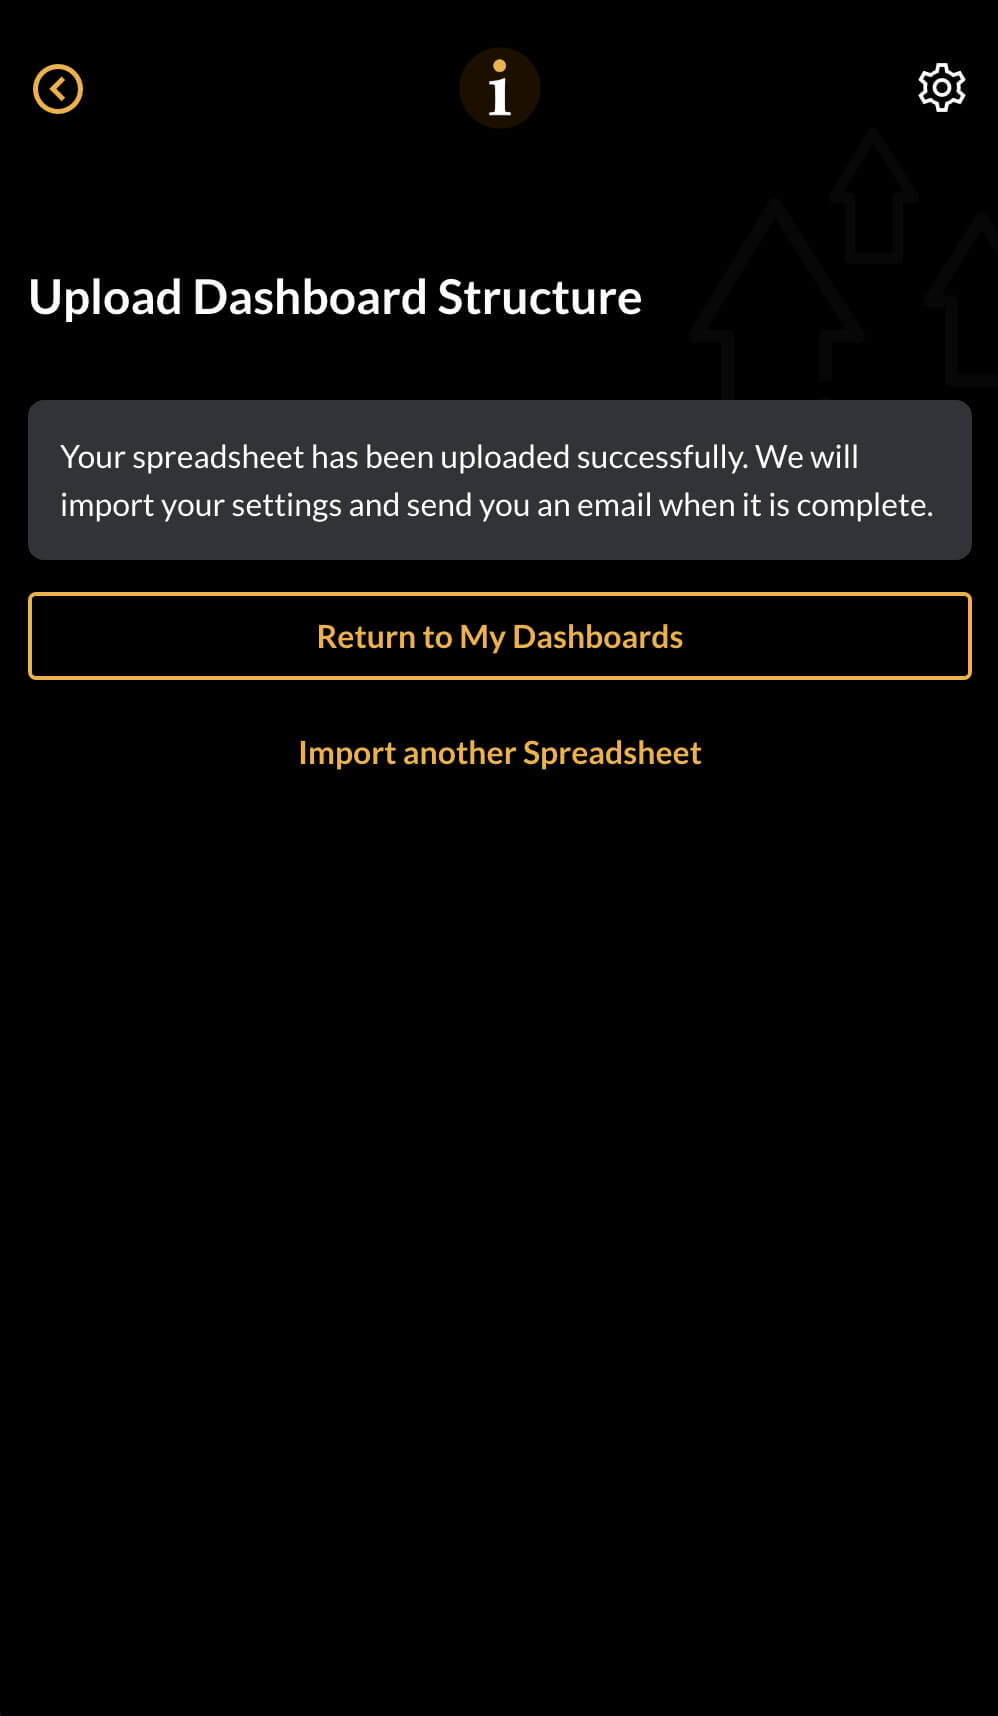
If your upload succeeds, you will see this message:
Your spreadsheet has been uploaded successfully. We will import your settings and send you an e-mail when it is complete
If the upload does not succeed, you will receive an e-mail suggesting a fix.
It might take a minute or two for the upload to process.
Have a cup of coffee and go to the next step.
The result
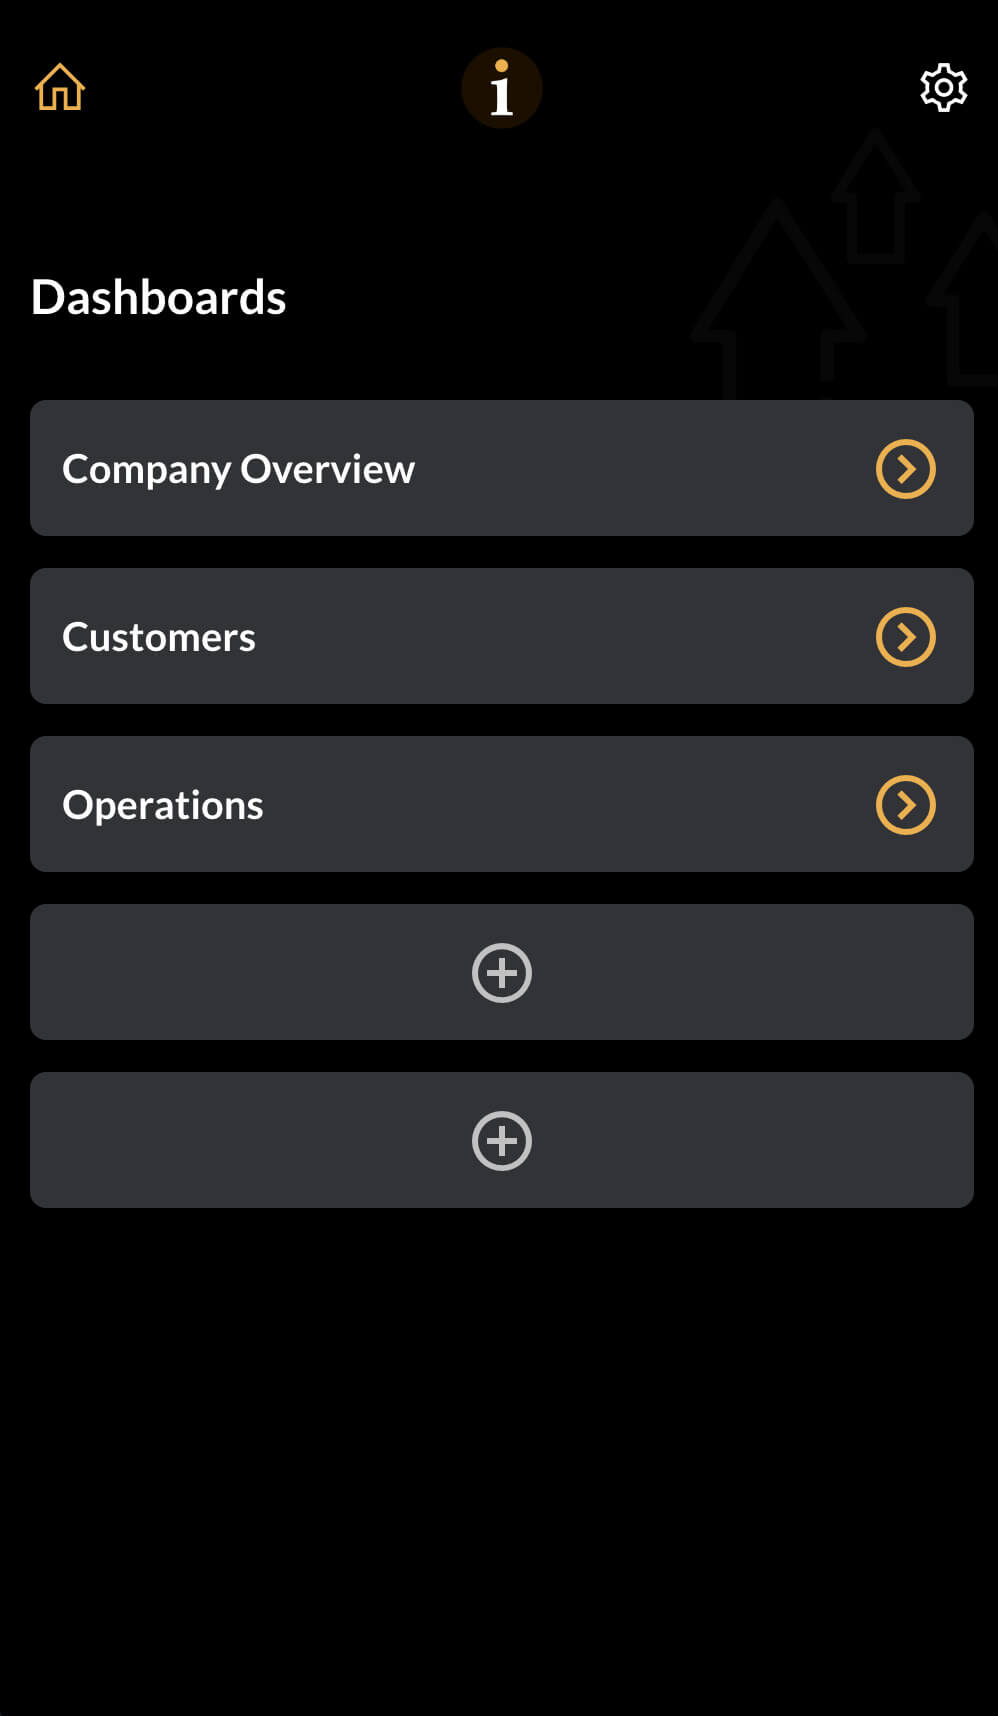
Go to your dashboards by clicking on the Home button on the top-left of the screen (or tap the return button twice).
The result of our upload looks like this.
Notice that you can still add another two because we only added three dashboards.
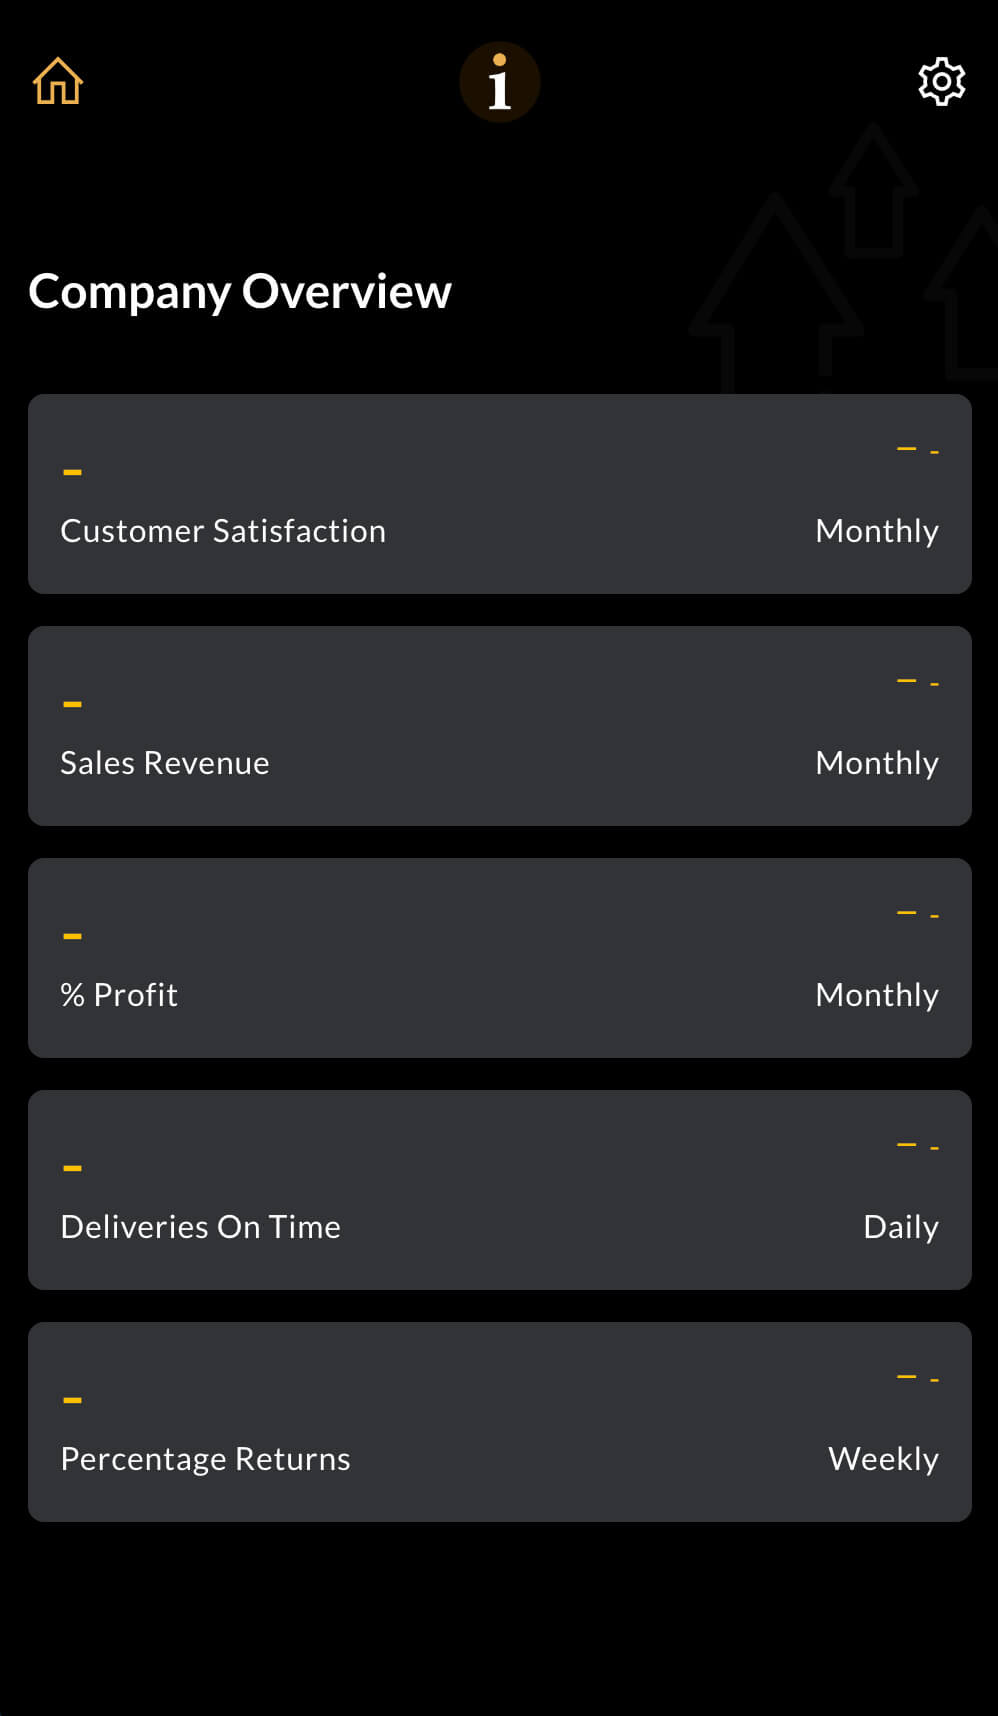
Click on any dashboard to see your KPIs. The next task is to add some KPI Actual Values.
The result – KPIs
The example shows the Overview dashboard with the KPIs defined, but the KPI daily, weekly or monthly Actual Values have not been added.
You can add KPI actual values in three ways:
Important Note: The actual values will be uploaded automatically every evening if you link to Google Sheets. This is by far the most efficient way to use the App.
Go to one of the update methods shown above.
