My5 – Viewing your data
Viewing your data
My5 allows you to keep track of your most important Key Performance Indicators (KPIs).
We believe that any small business or department of a larger organisation can be run efficiently by tracking groups of 5 KPIs.
My5 allows you to track 5 KPIs in 5 dashboards. So a maximum of 25 KPIs.
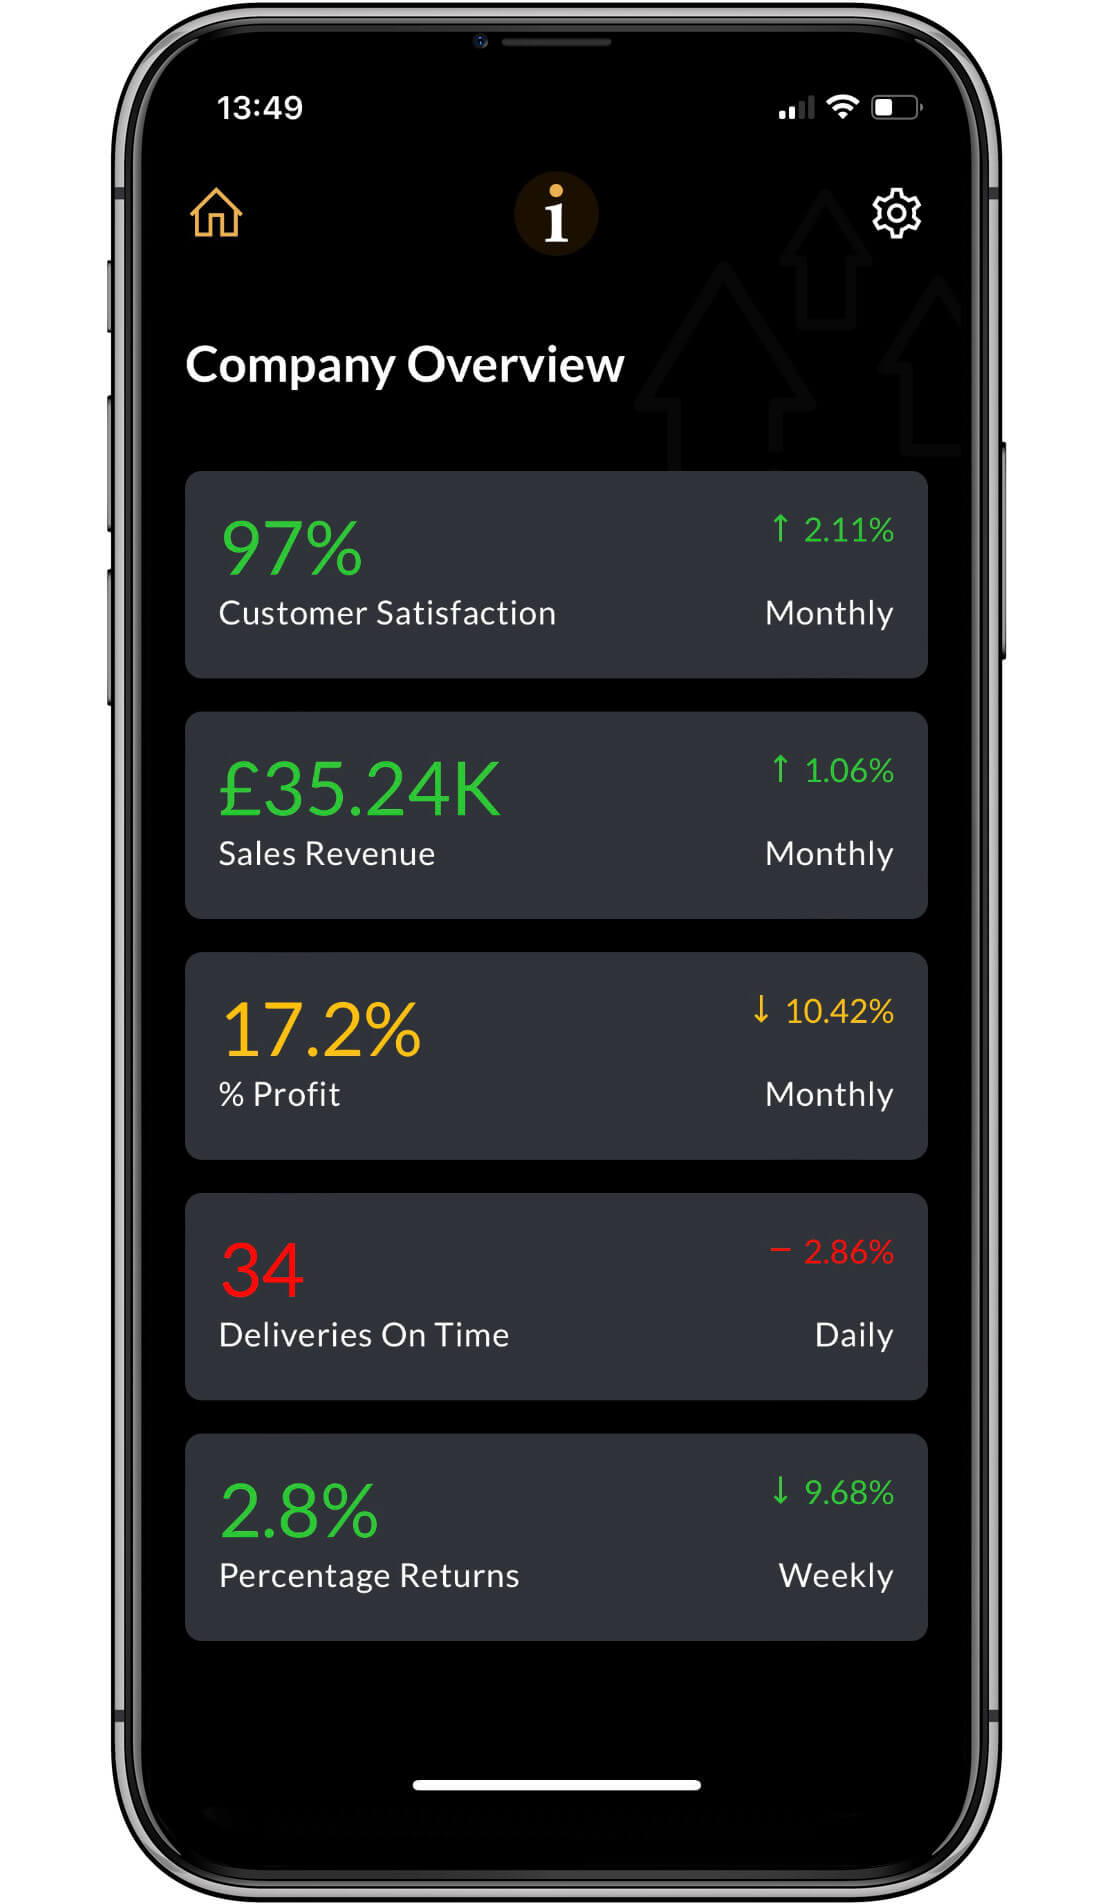
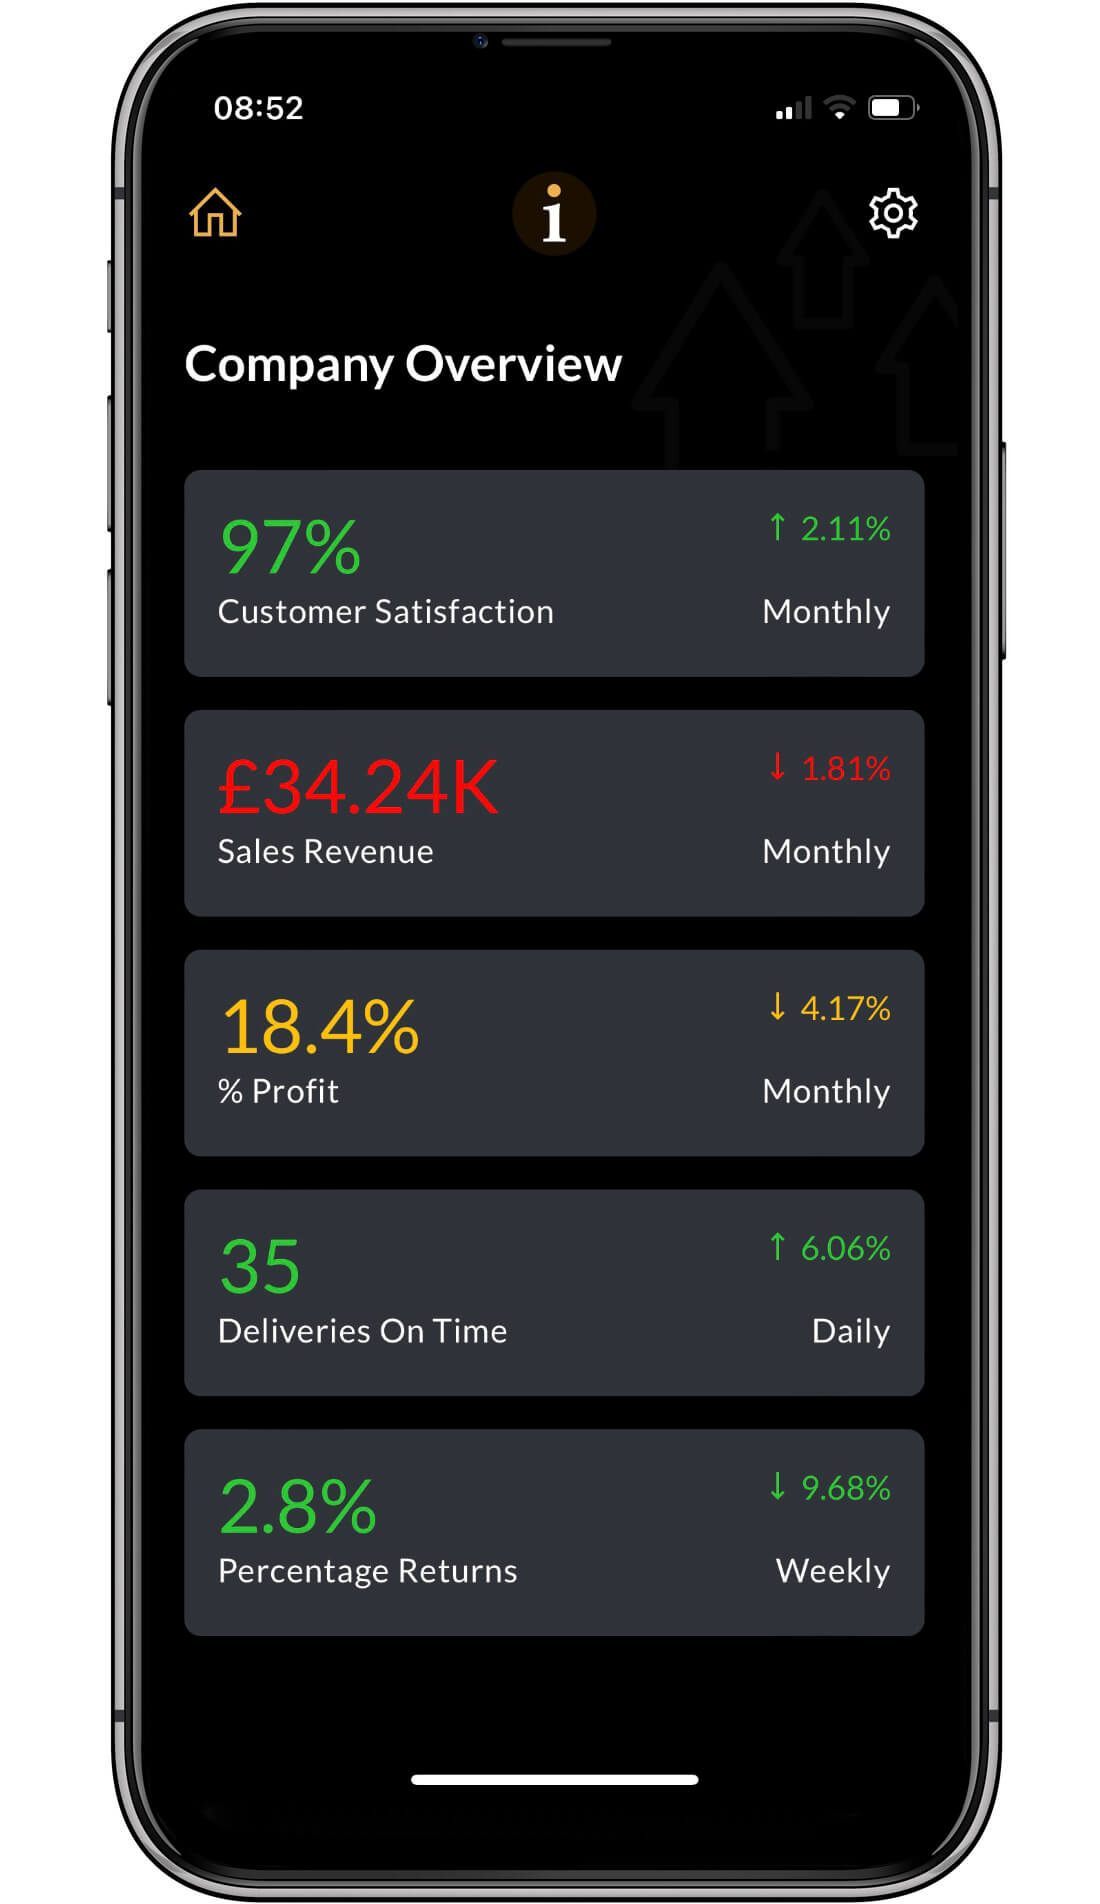
Once you have added a set of KPIs to a dashboard, when you sign on, you will be taken directly to your first dashboard, it will look something like this.
You have an option in Settings to look at a List view or a Grid view like the one below. The list view provides more information than the Grid view, which provides the barest minimum.
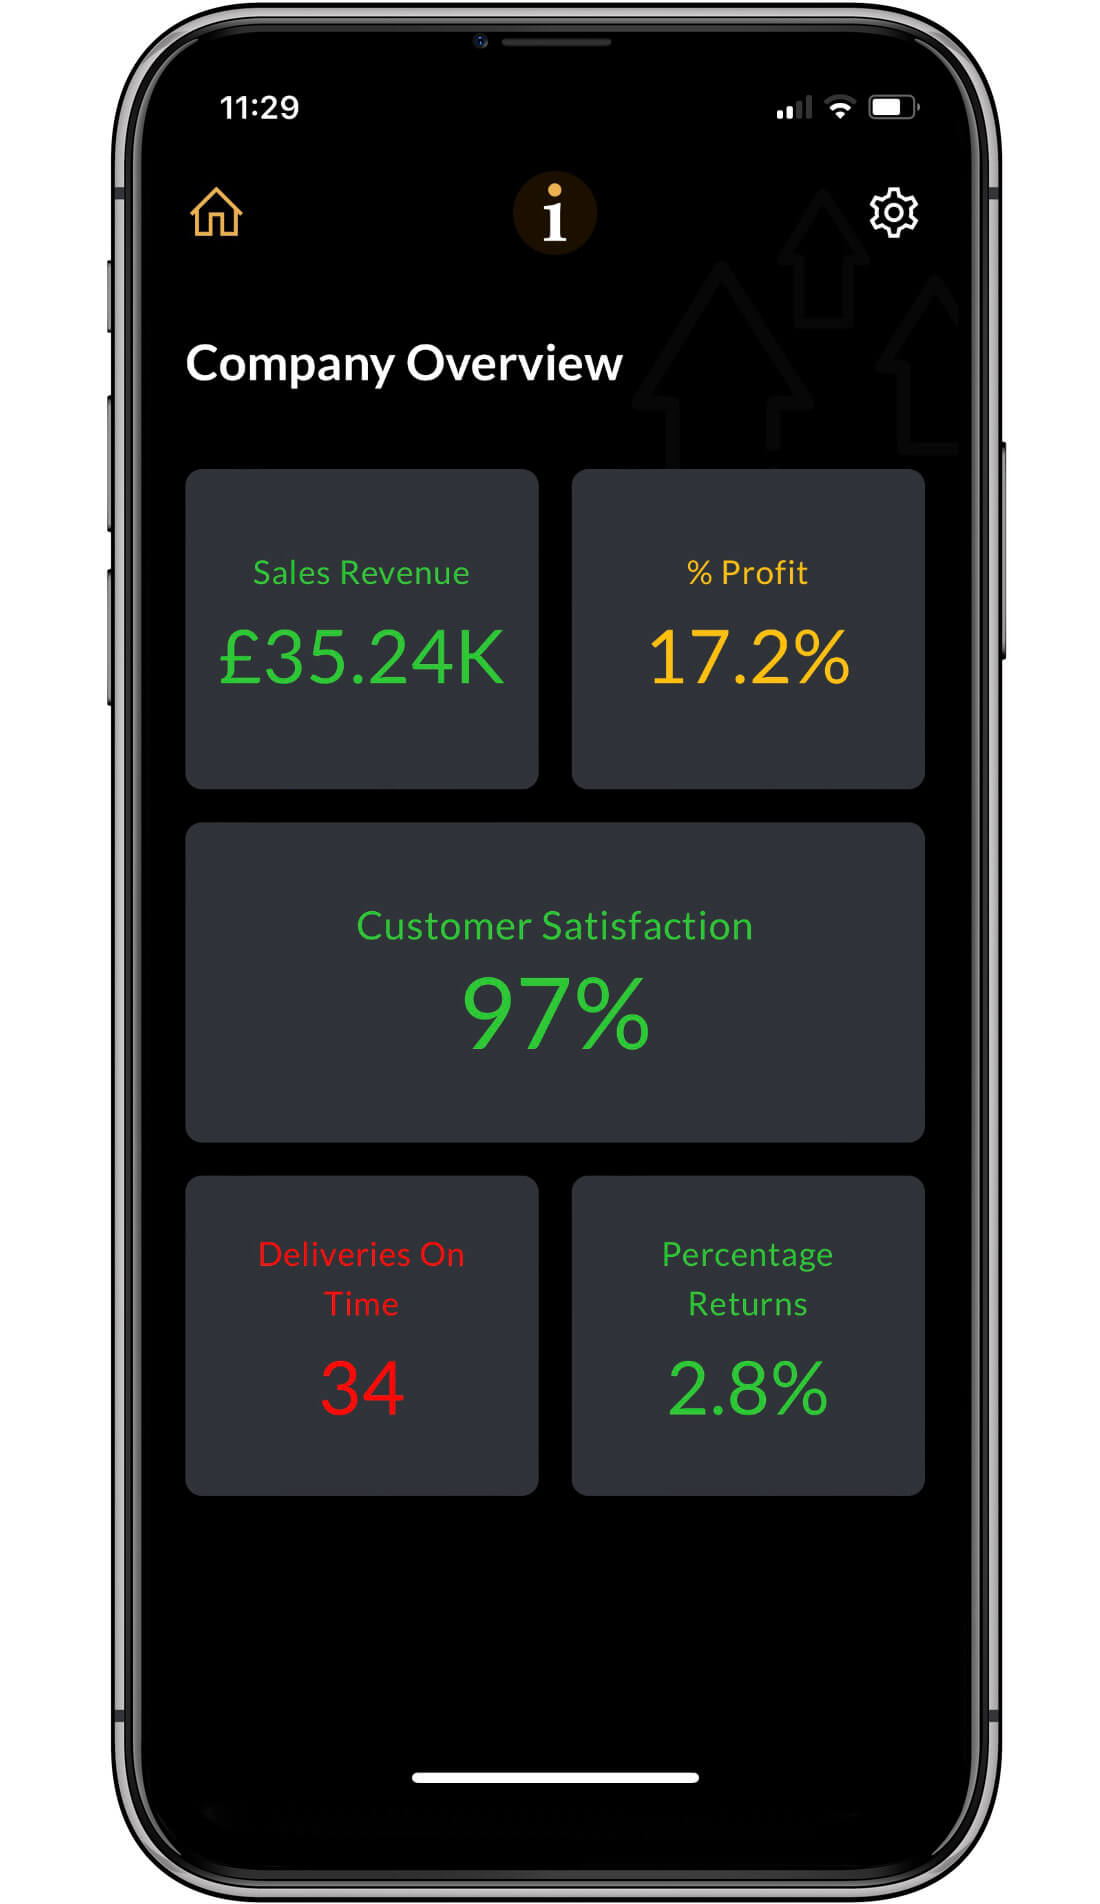
Grid view
If you want a dashboard as a Grid view, click on the settings cog (top-right) and then click on Edit Dashboards and KPIs. Select the dashboard and under Layout, select Grid.
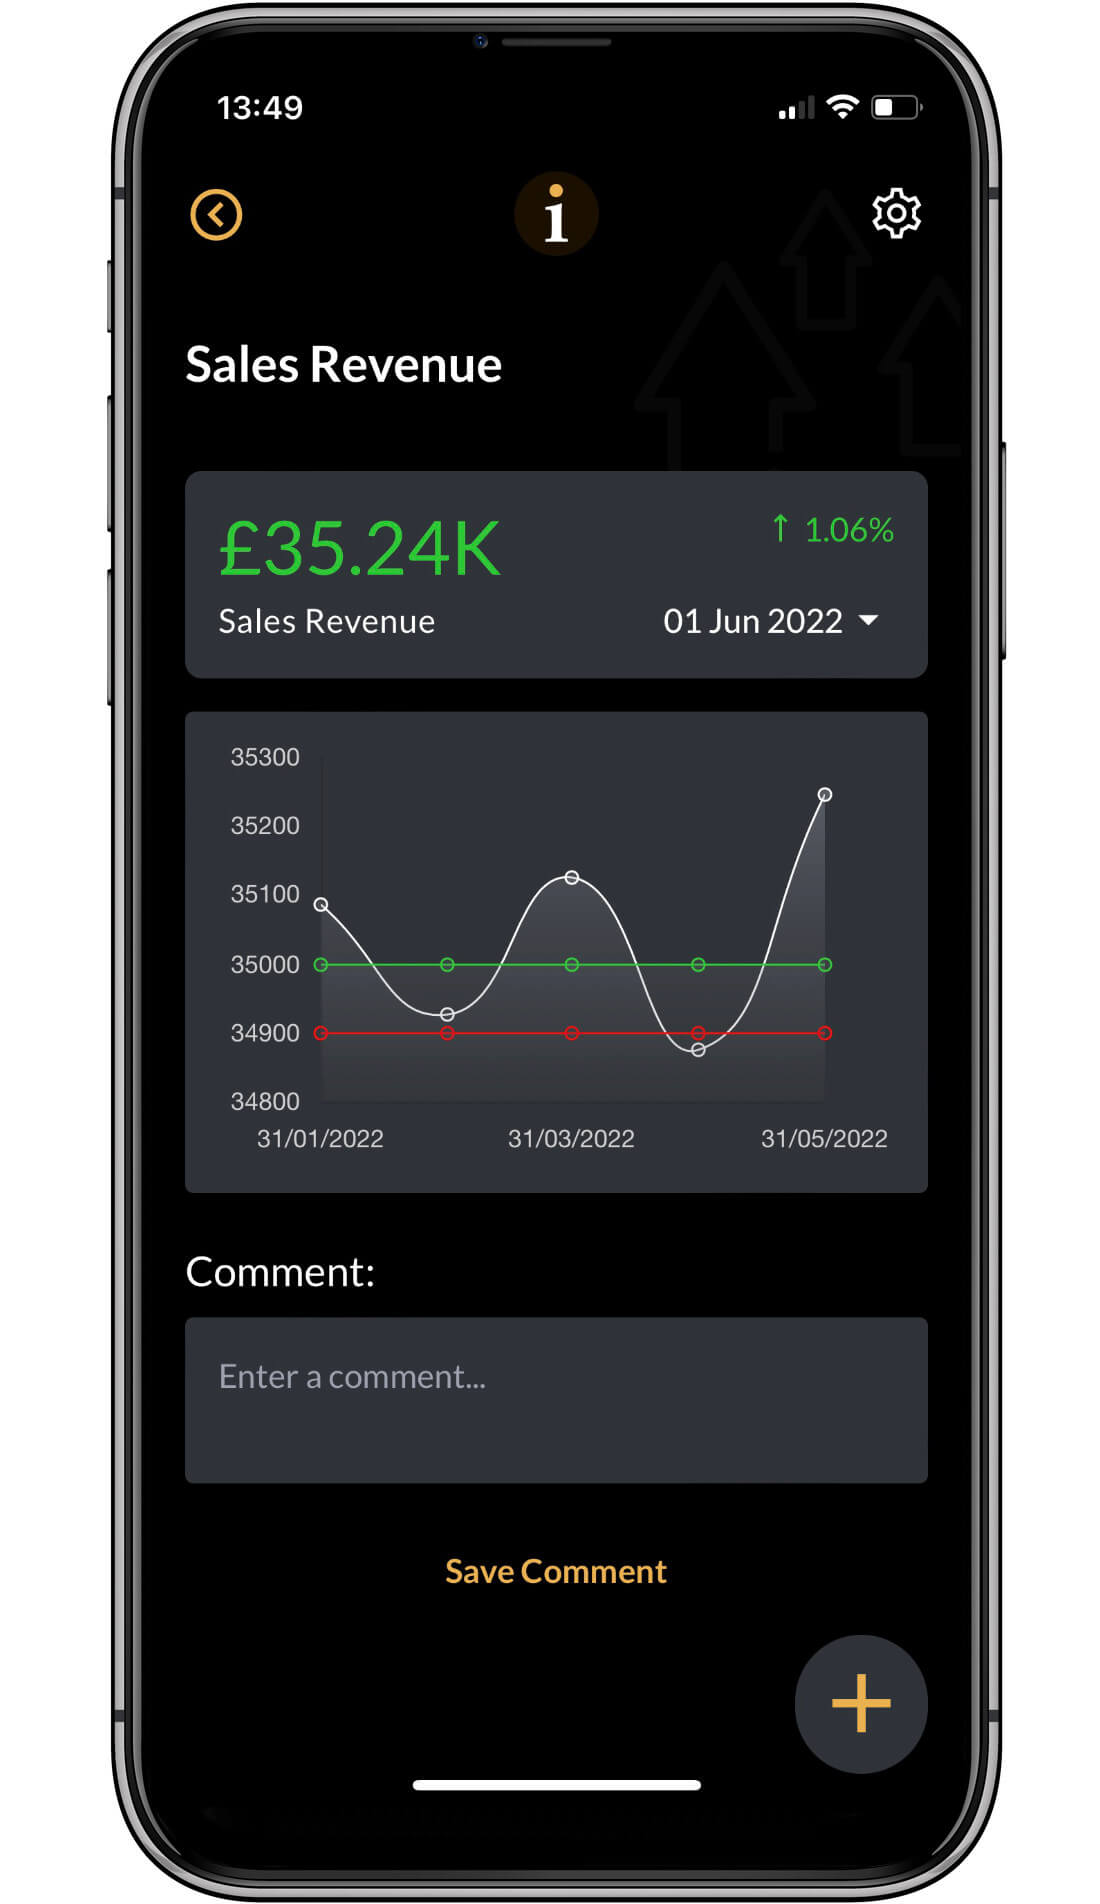
On the List view or the Grid view, you will see a details screen if you click on a KPI.
Logical Flow
My5 provides a logical flow of three screens for a general user, that is, a person who needs to look at the data:
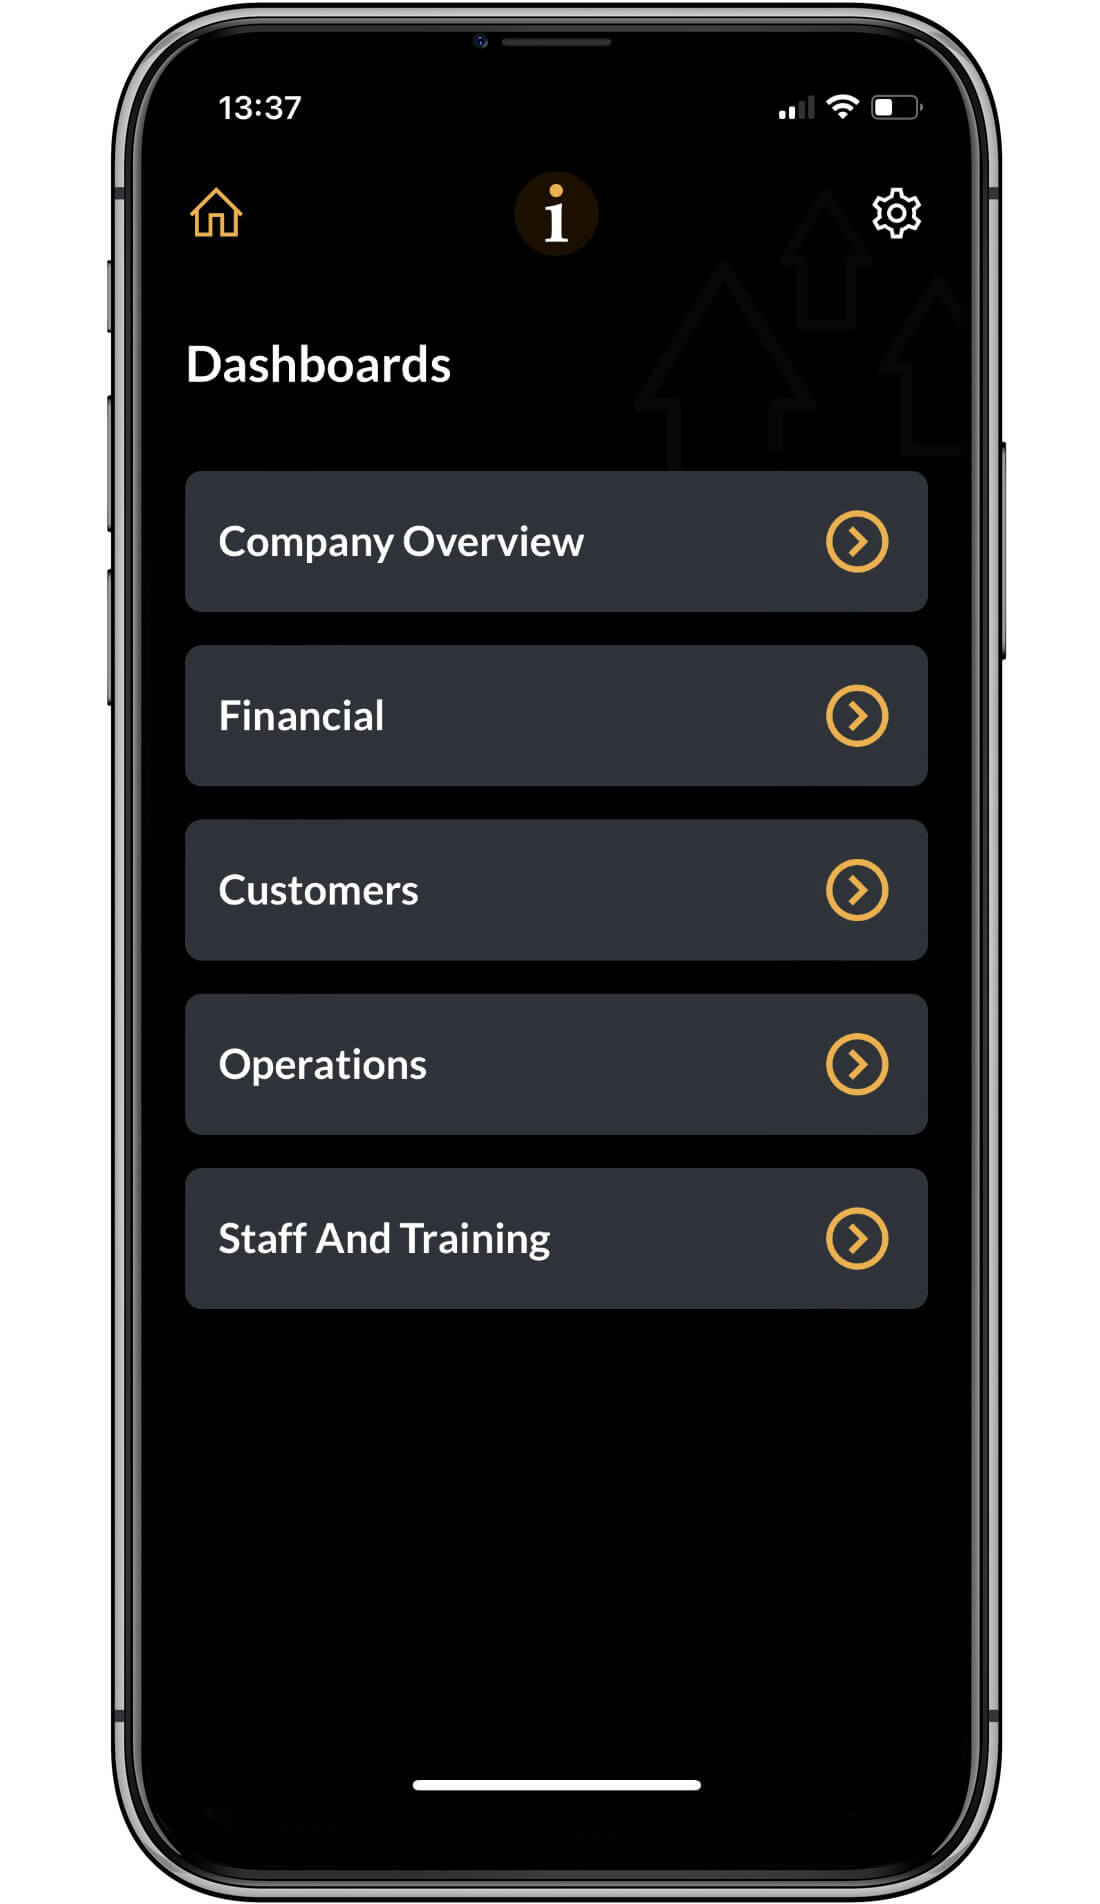
- By clicking on the Home button, they will be presented with a dashboard list.
- By selecting a dashboard, they will be presented with the 5 KPIs in the dashboard.
- If they select a KPI, they will be presented with the KPI details, including six periods of history, a comments box, and an update button if they have update permissions.
