My5 – Add dashboards and KPIs
Add dashboards and KPIs manually
You will see an empty dashboard screen the first time you sign into My5.
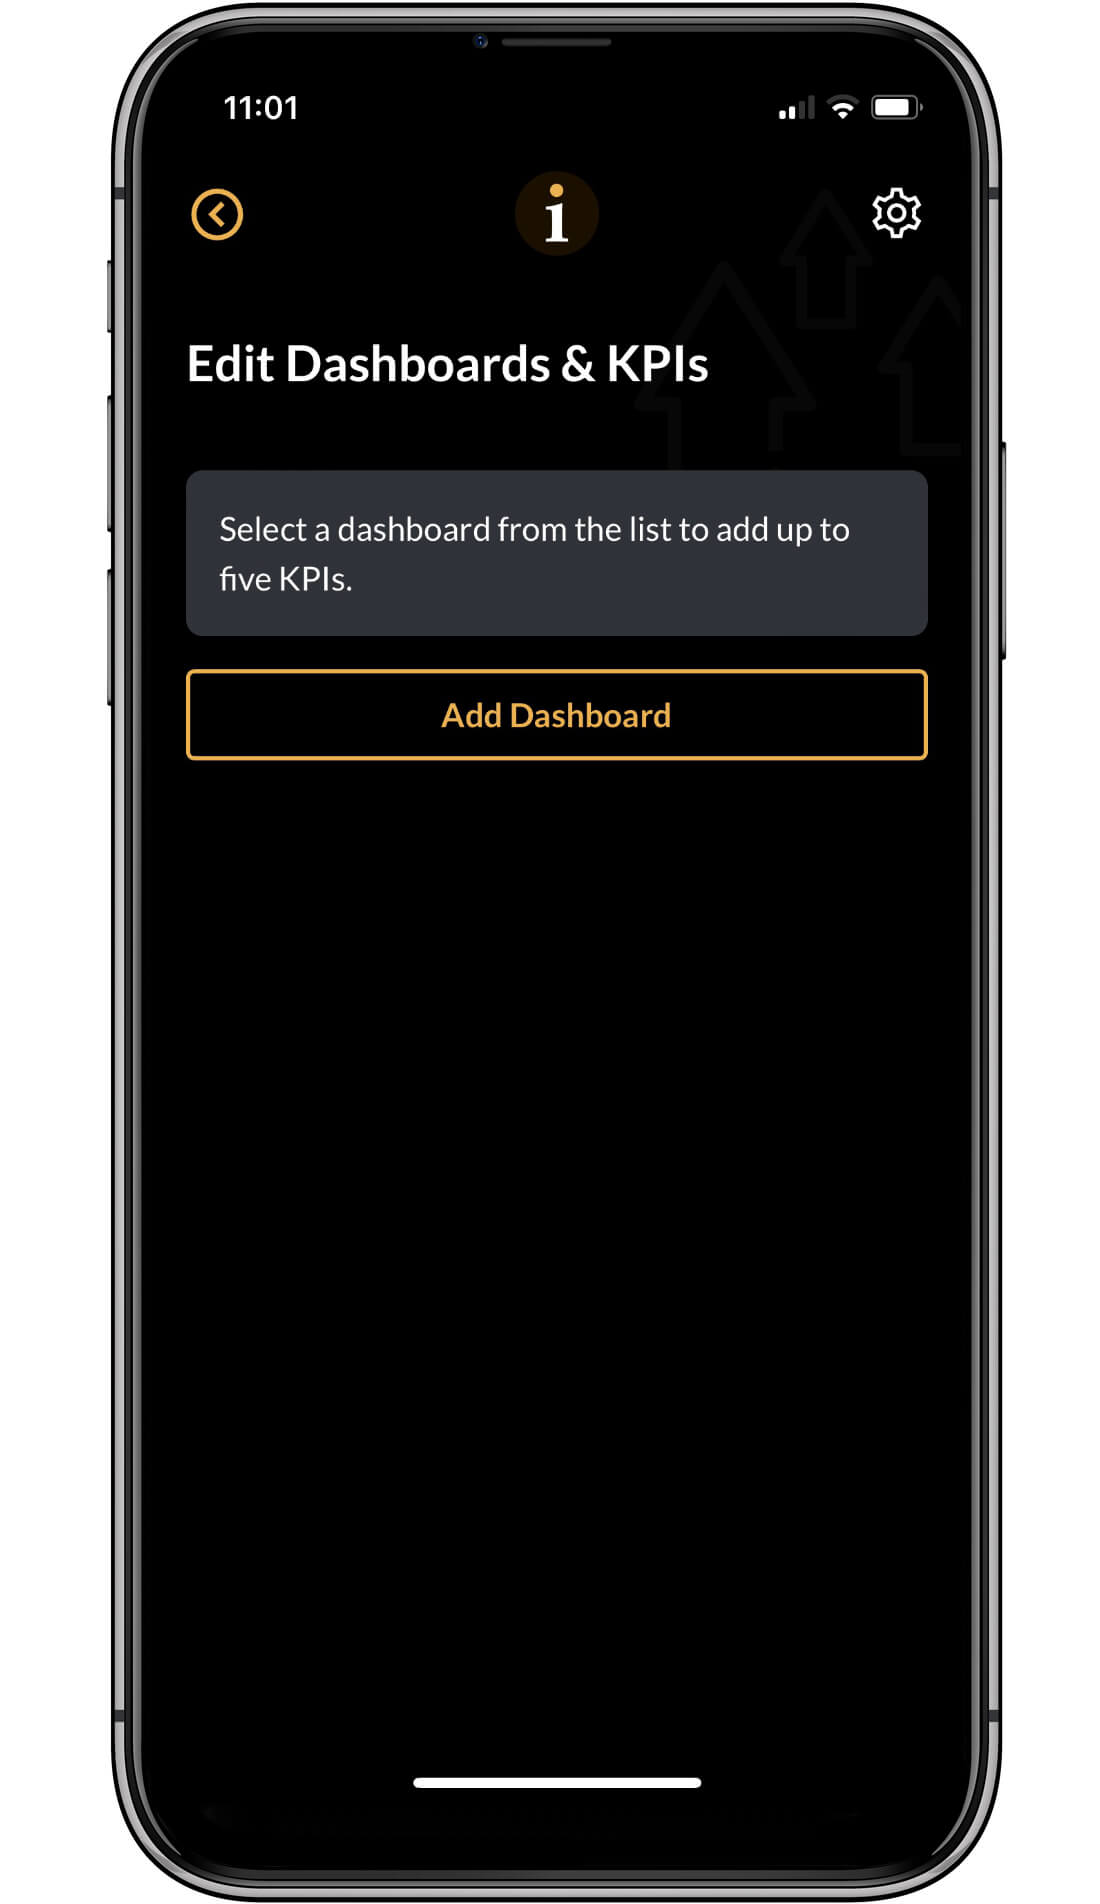
Your first task is to add a dashboard and some KPIs. Click on the settings cog at the top right and select Edit Dashboards and KPIs.
<<< Watch the Video
Or read the user guide below.
Add a dashboard
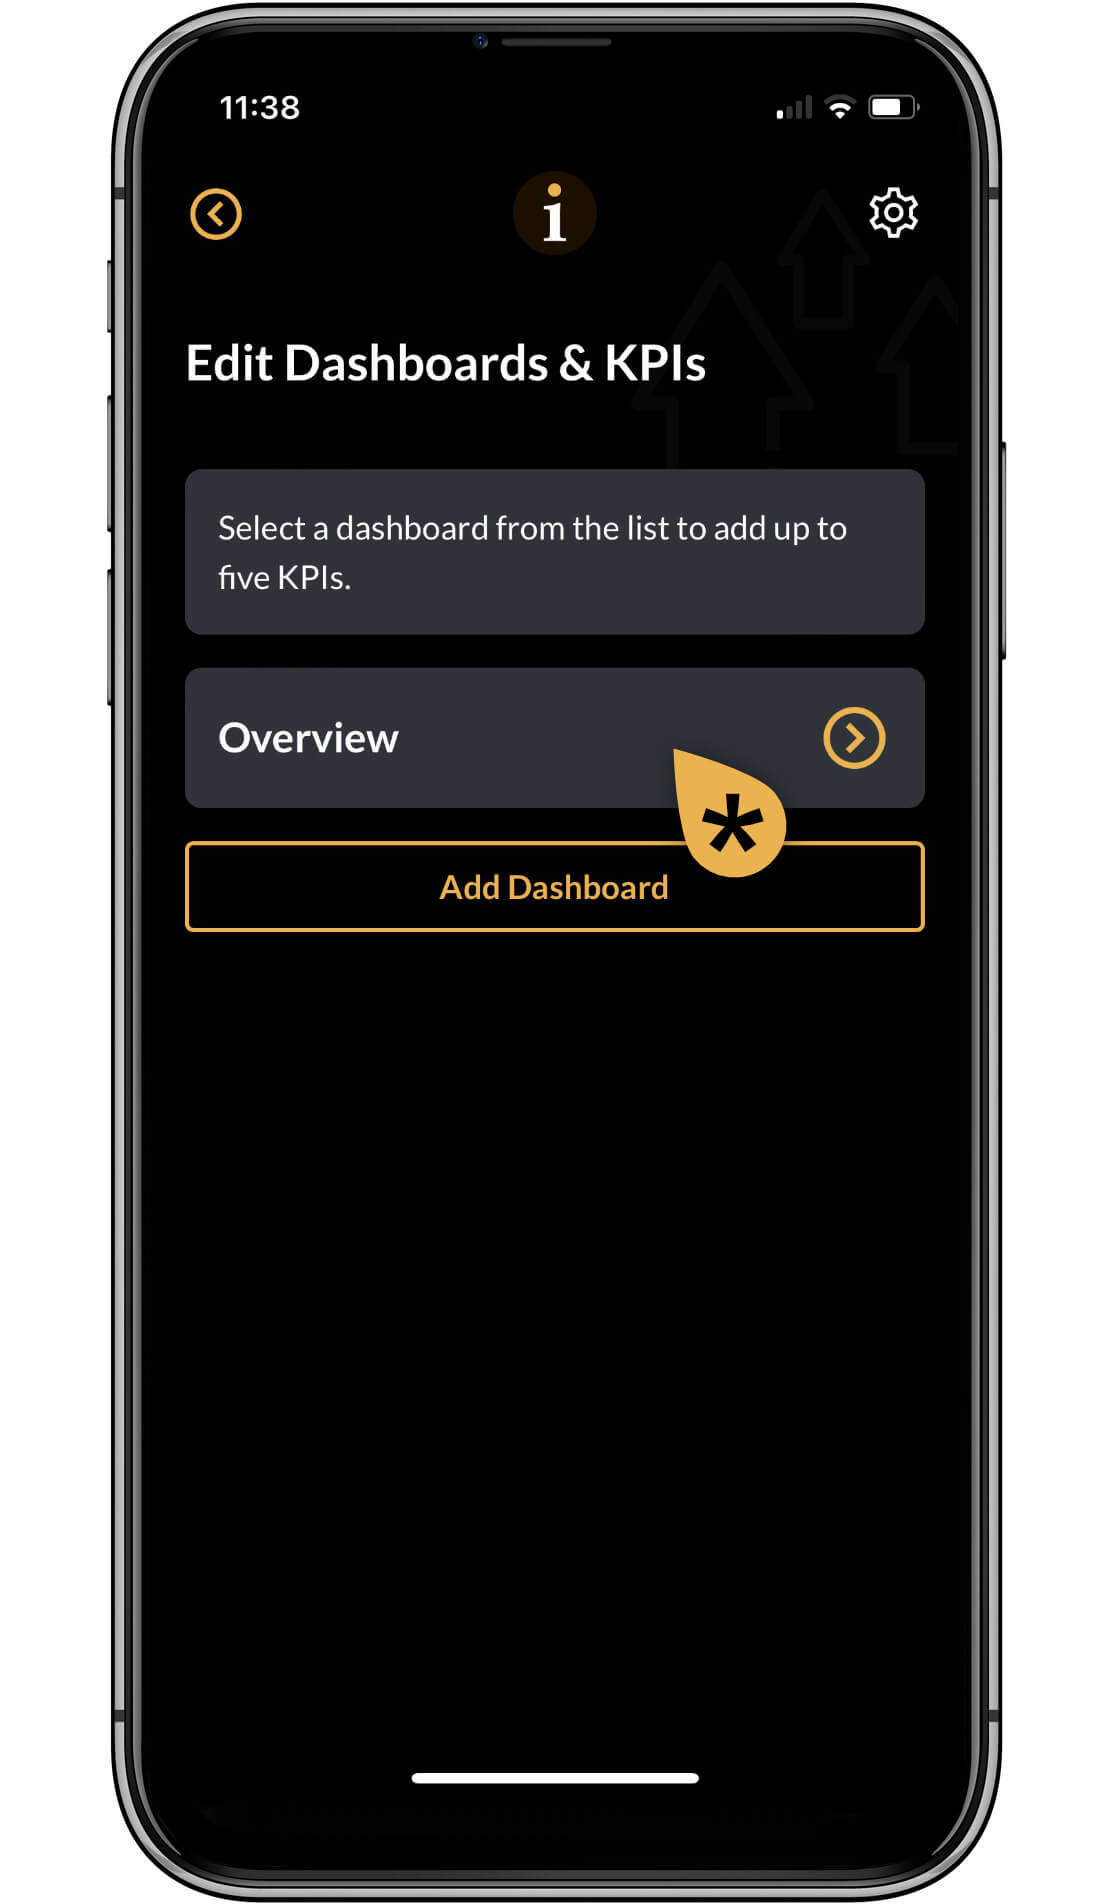
If this is the first time you have added a dashboard, you will see a screen like this. Click on Add Dashboard.
Go to the next step
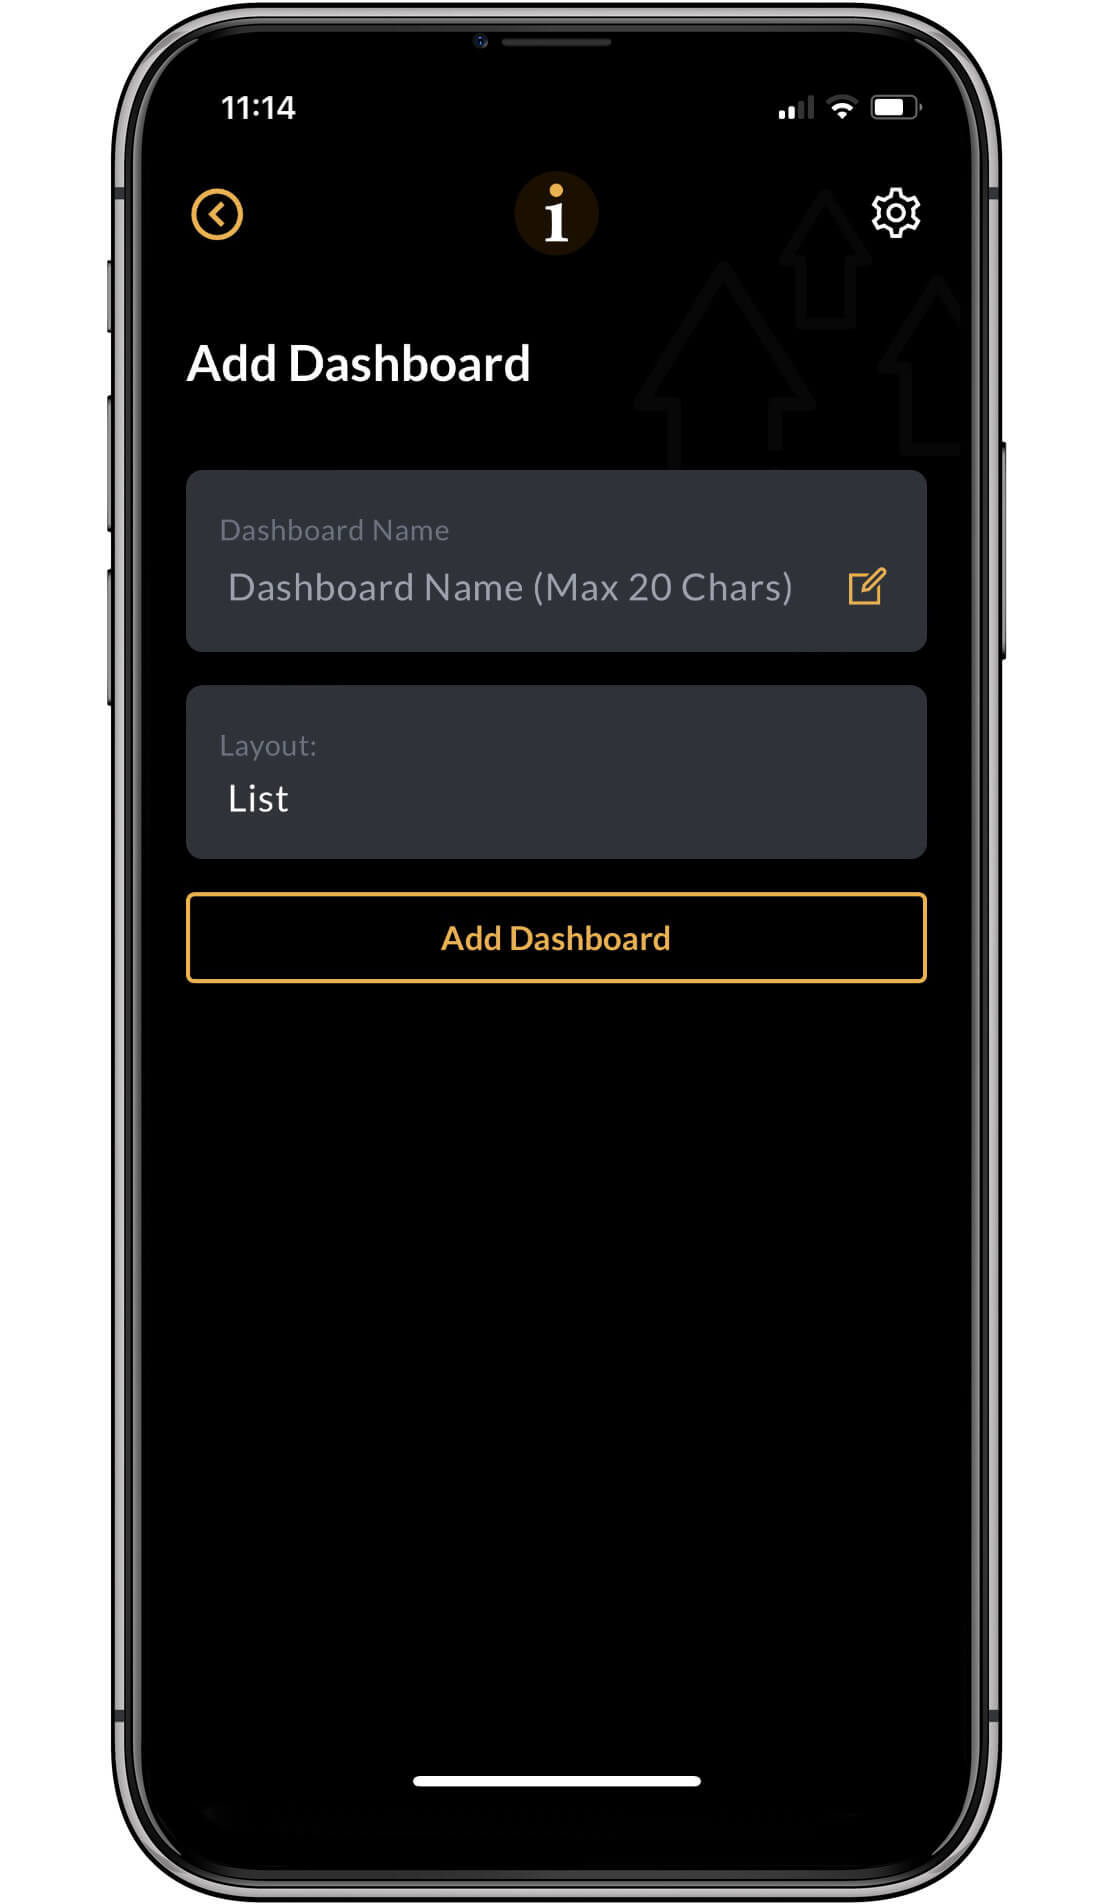
Name the dashboard
Name your dashboard. You can have up to five dashboards, each containing five KPIs. It might be worth spending a moment thinking about what you want to display for your organisation.
For example, you might want the first dashboard to be an overview, the second to look at financial KPIs, the third to look at marketing and sales, the fourth to look at operational KPIs, and the fifth to look at investment areas.
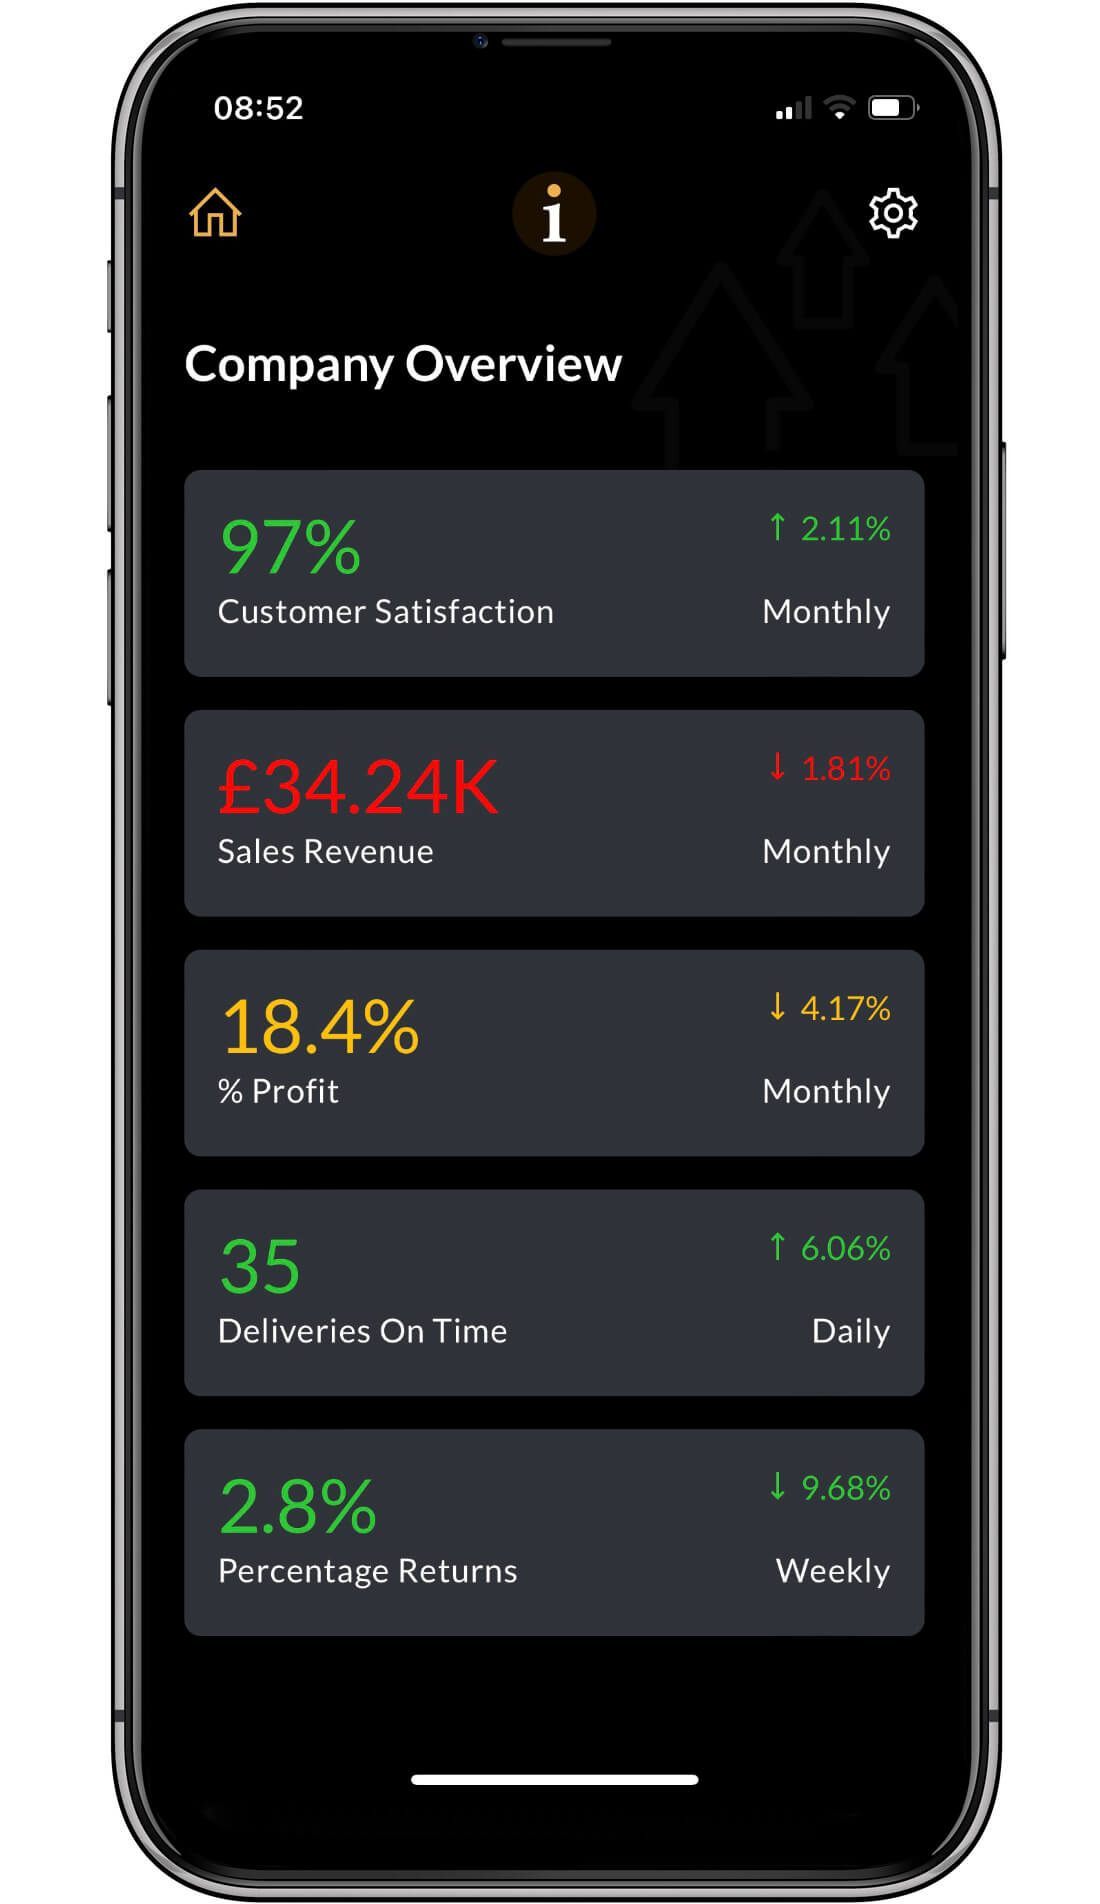
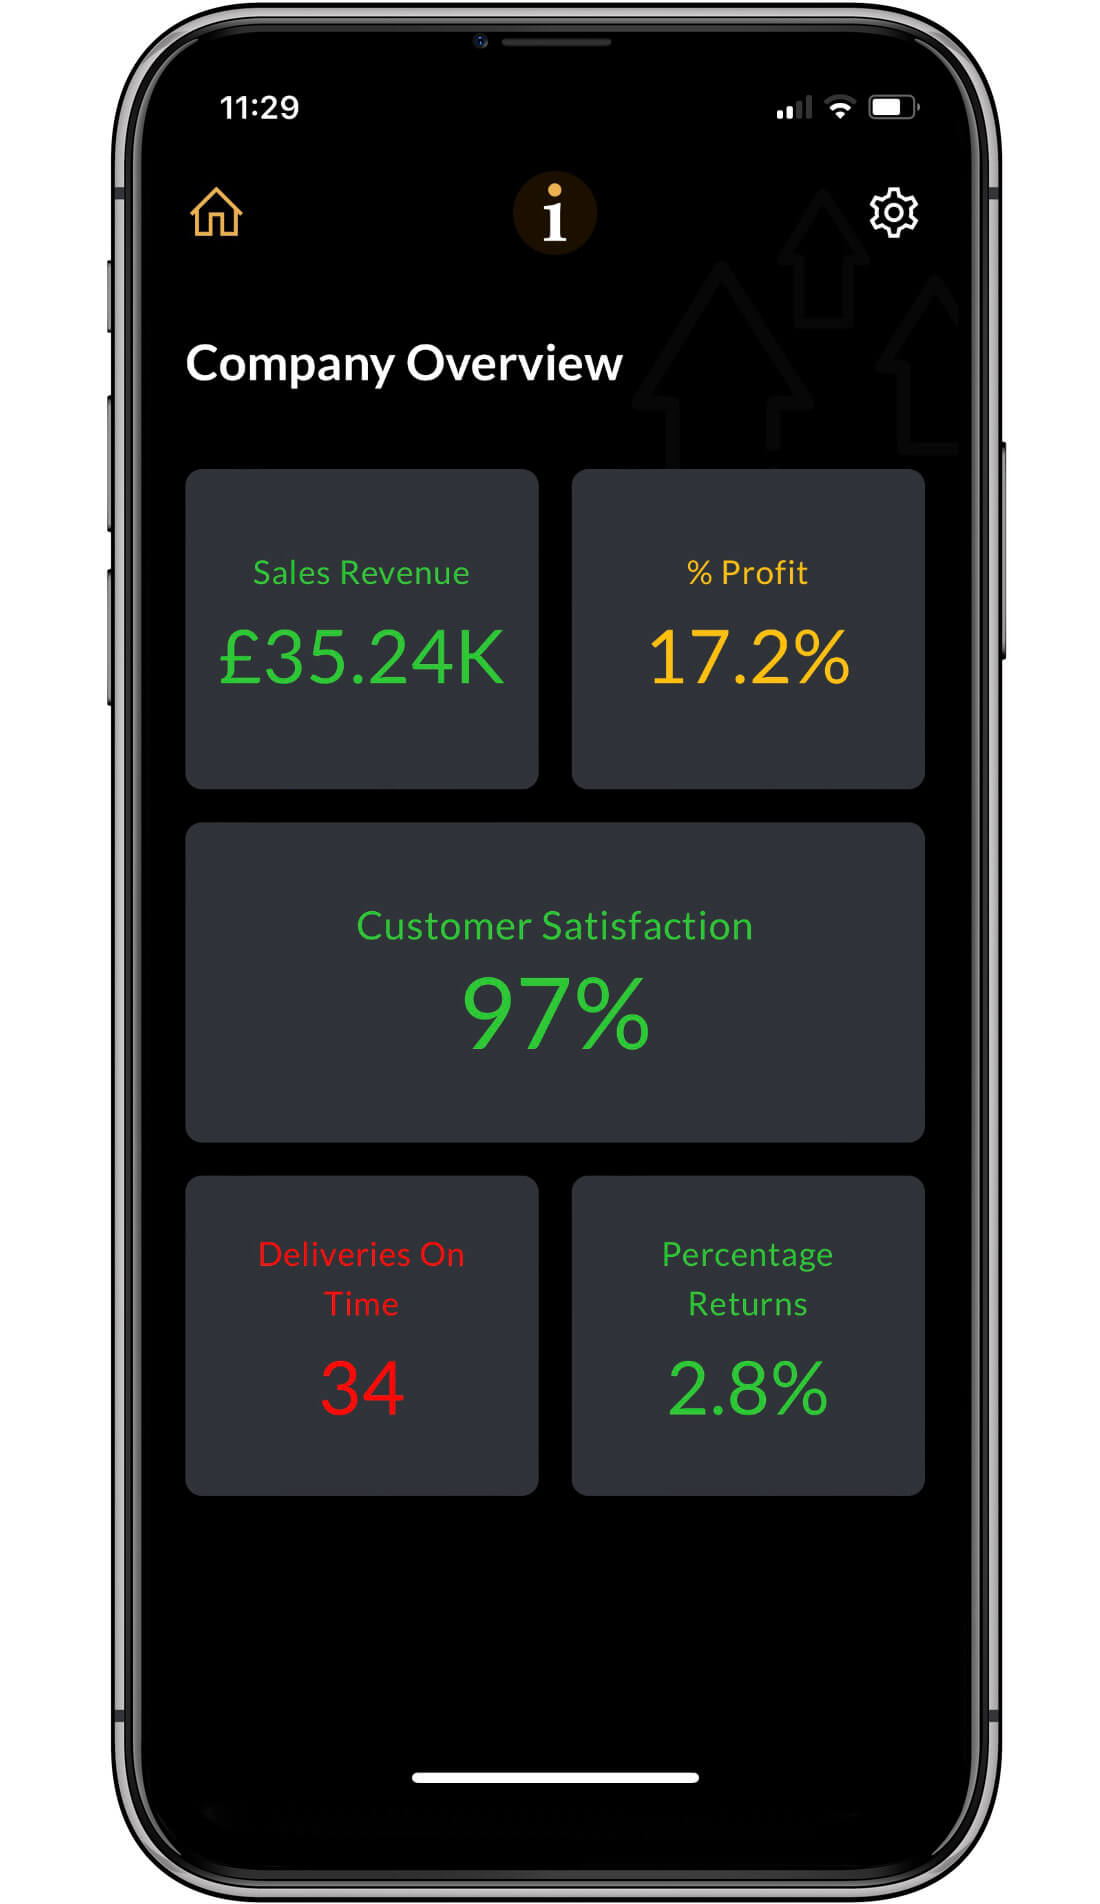
You can also select the Layout of the dashboard. It can be in a List format or a Grid format. There are examples of each below.
Add some KPIs
In the example, you can see we have added a dashboard called Overview. This will be added to your dashboard list.
At this point, the dashboard does not contain any KPIs. You can add some more blank dashboards if you wish, but we suggest adding some KPIs to this dashboard first.
Click on the dashboard in the list.
Go to the next step.
Add your first KPI
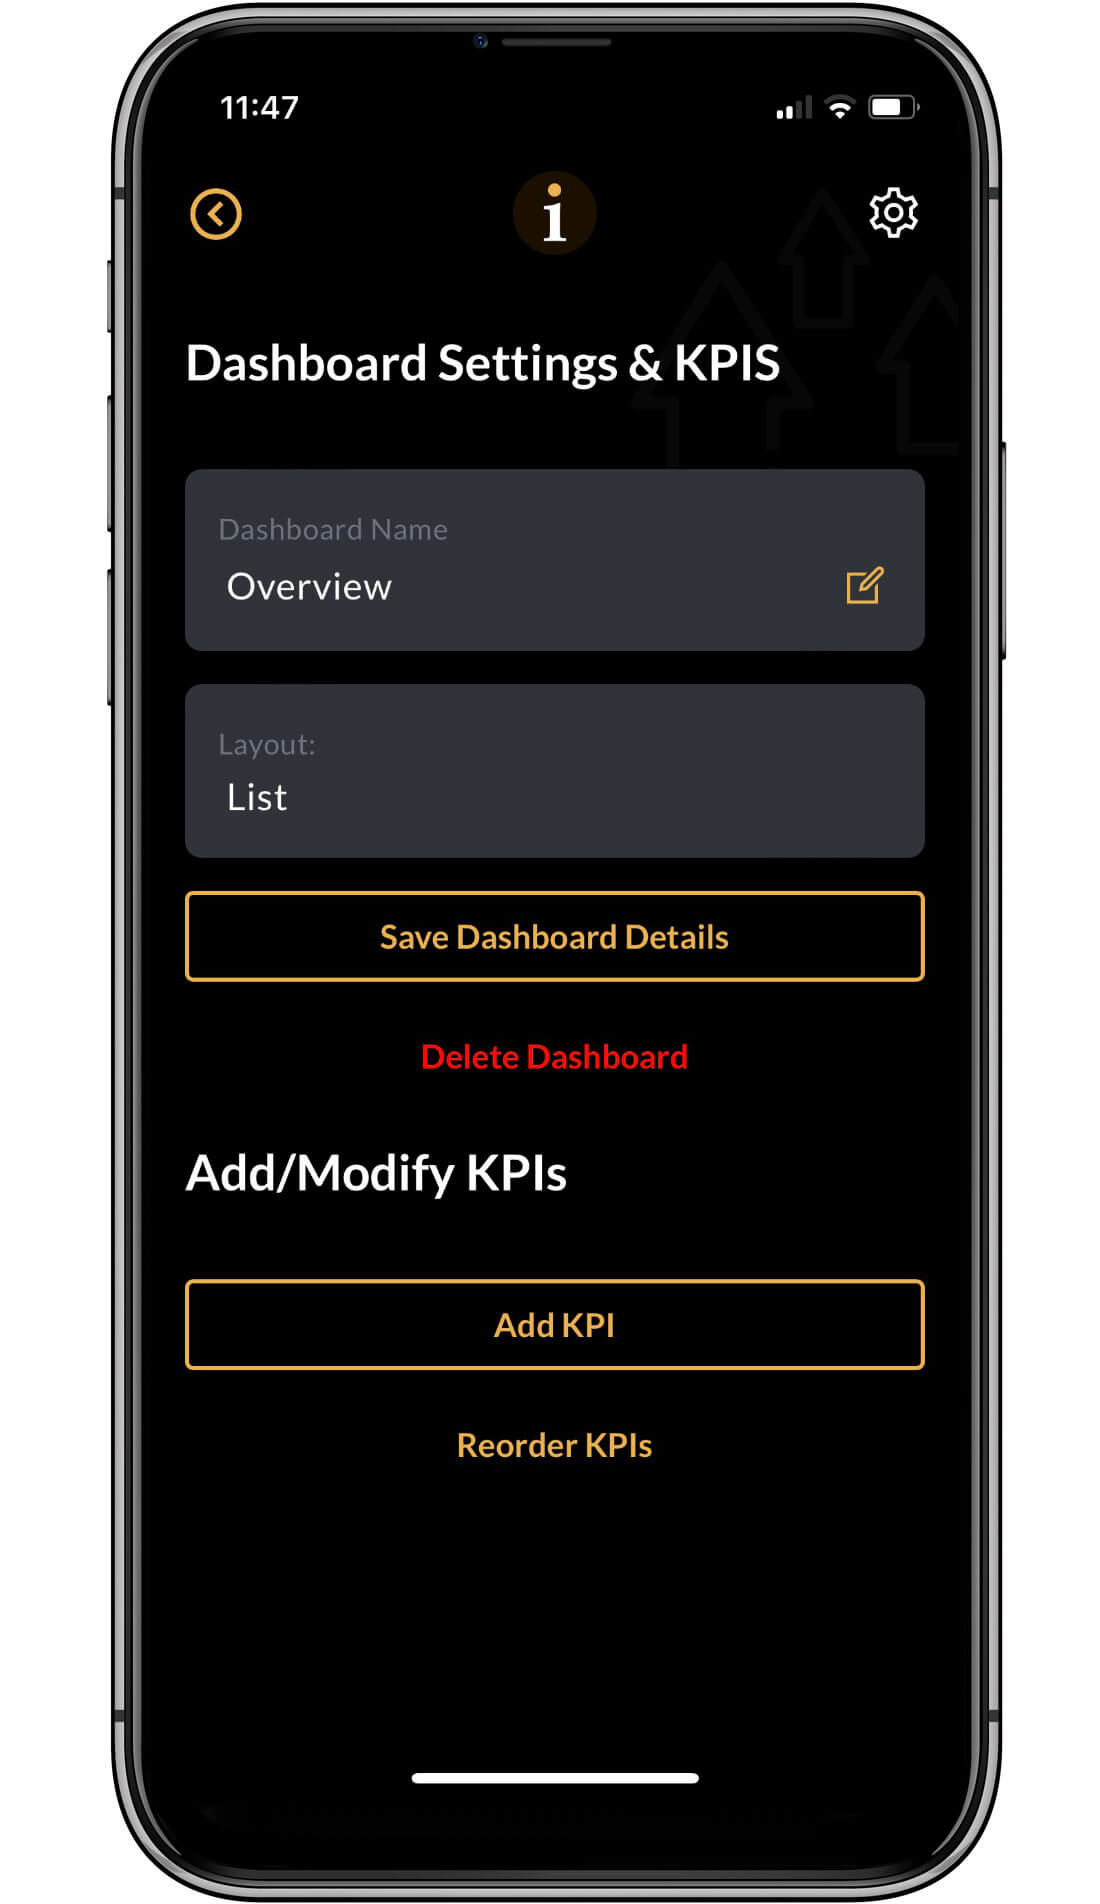
You can come to this screen at any time via Settings and by clicking on Edit Dashboards & KPIs. You can modify the name of your dashboard, change it from a List to a Grid view, delete the dashboard and add a set of KPIs.
To add your first KPI, click on Add KPI.
NOTE: when you have added a list of KPIs, you can reorder them if you need to.
Go to the next step.
KPI Settings
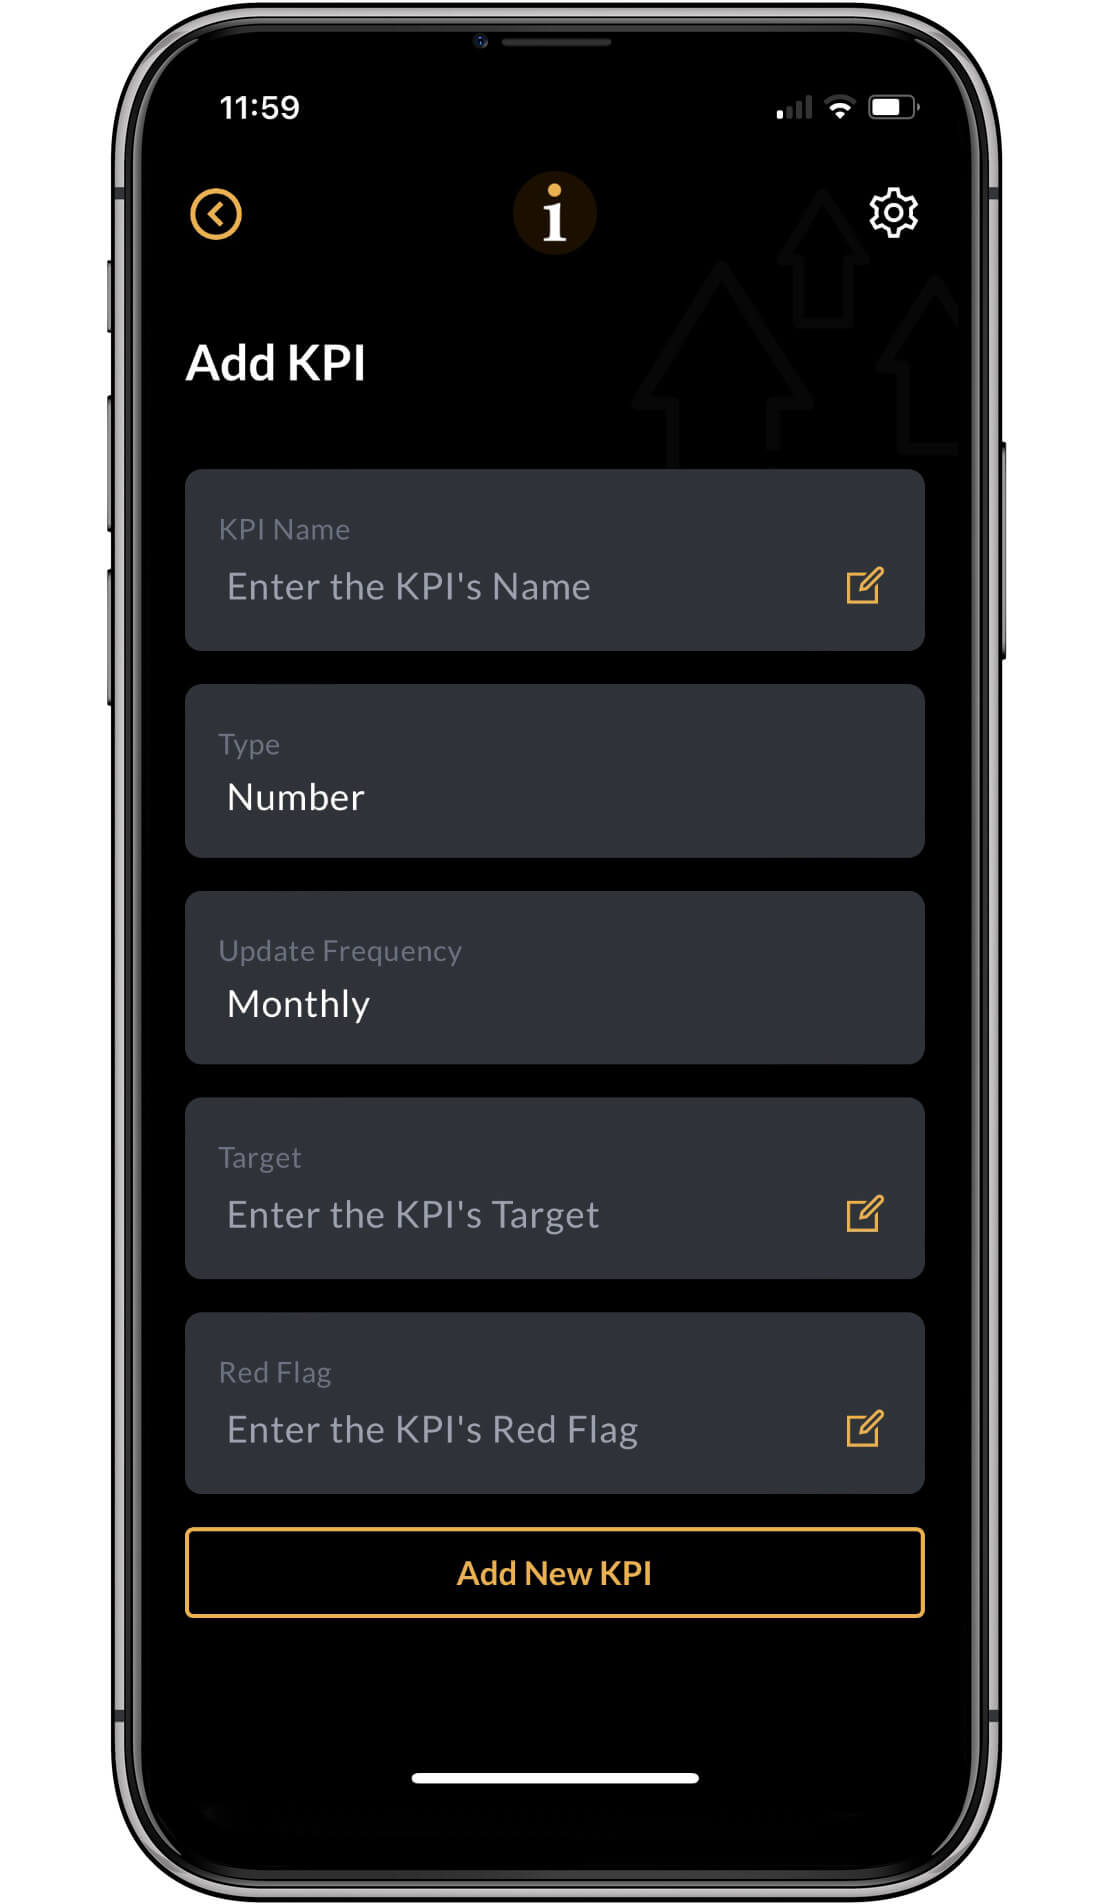
This is the most important input screen in the My5 app.
Here, you define the attributes of your KPIs.
NOTE: you can do this via a spreadsheet upload if you wish.
KPI Name: Add the name of your KPI. Try to keep all of your KPI names unique.
Type: the KPI can be a number, currency or percentage. If you select a currency, another box will appear asking for a currency symbol.
Update Frequency: how often will you update your KPI? It can be daily, weekly or monthly.
Target: The point at which you want your KPI to show Green
Red Flag: The point at which you want your KPI to show Red
Important notes on setting targets
When a target is hit, the KPI value in My5 will show Green.
When a Red Flag is hit, the KPI value in My5 will show Red.
Any value between these two numbers will show Amber.
A target does not have to be higher than a red flag. Often it is desirable to see a low, declining number, for example, the Number of Customer Complaints.
My5 will show Green, Amber and Red correctly depending on your values in the Target and Red Flag settings.
KPIs Added
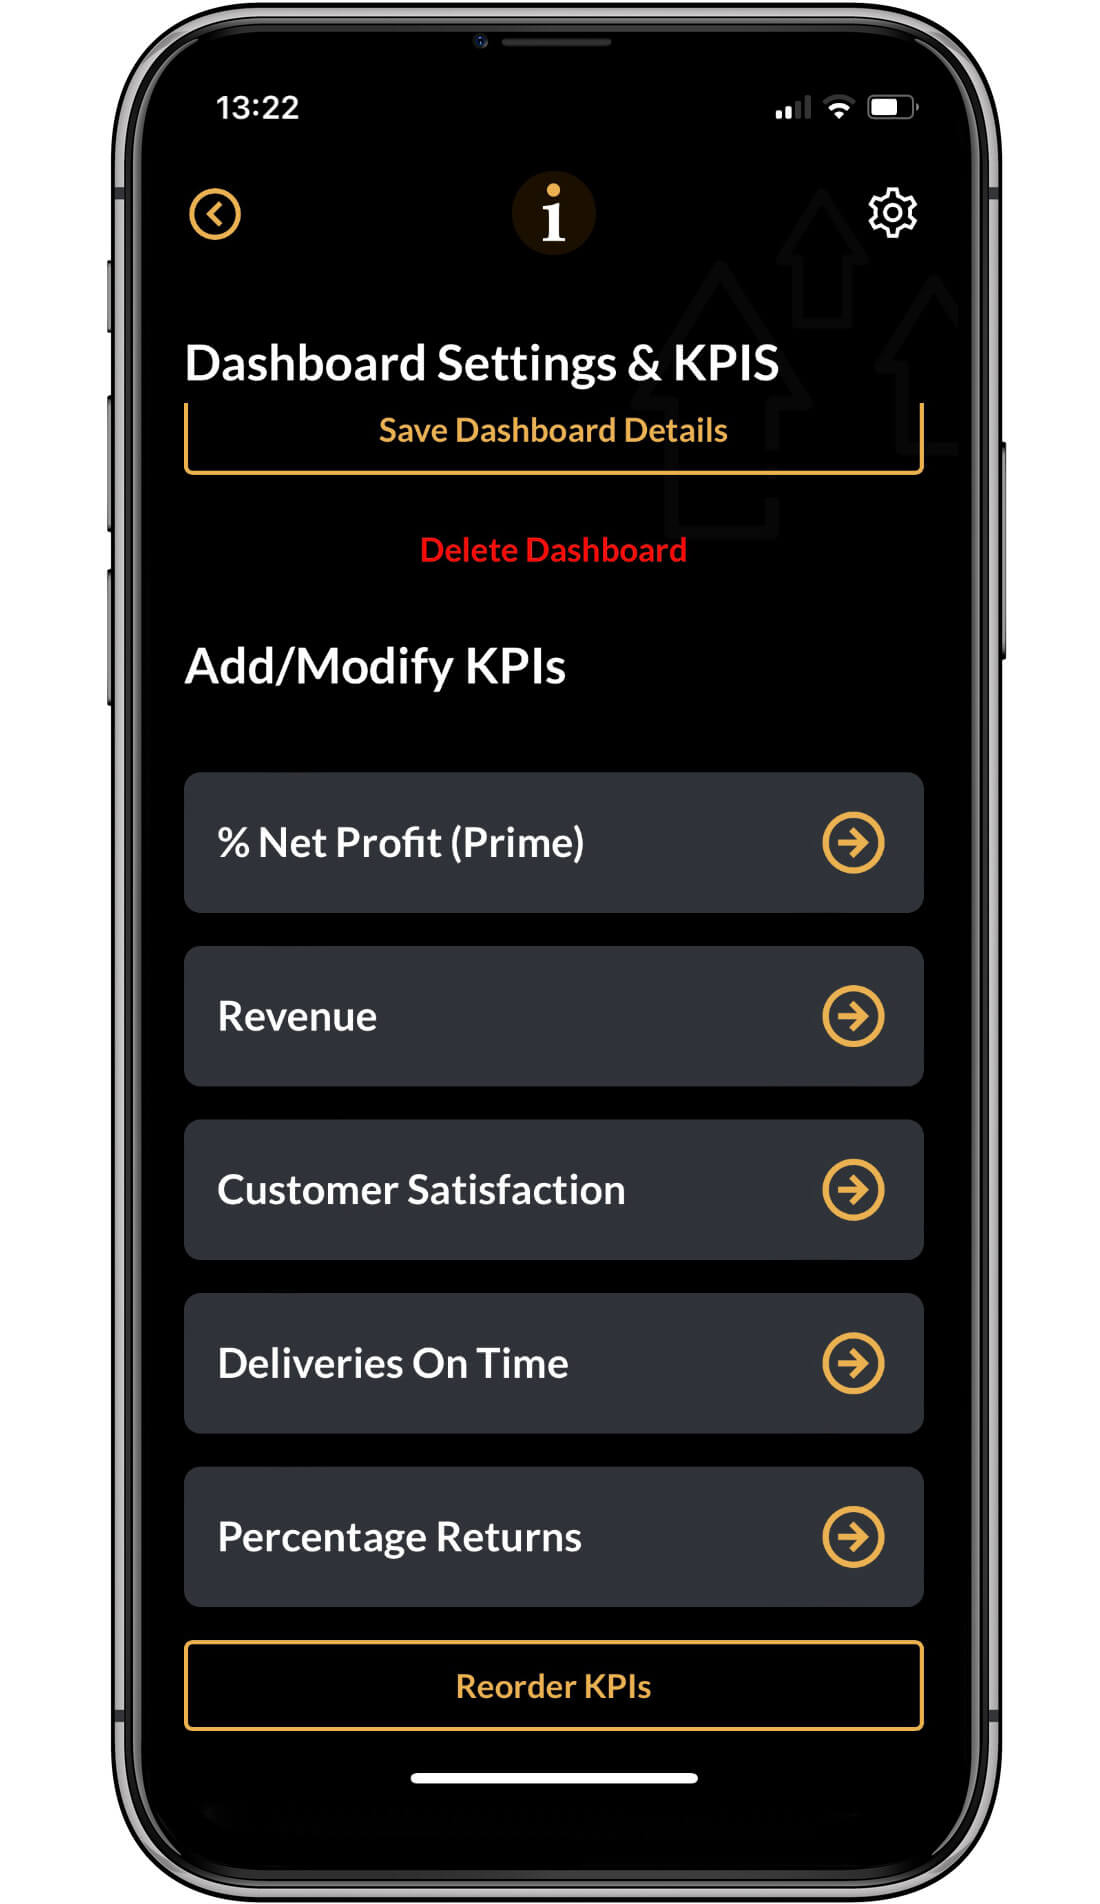
When you have added your five KPIs, you should see a screen similar to this one. If you need to change your KPI settings, you can come back to the screen via Settings (Cog, top right) > Dashboard Settings and KPIs. Click on the KPI you need to edit, and the App will take you to the edit screen.
Click on the Settings cog, top left, and then the Home button to see the dashboard. This will take you to the dashboard list.
Go to the next step.
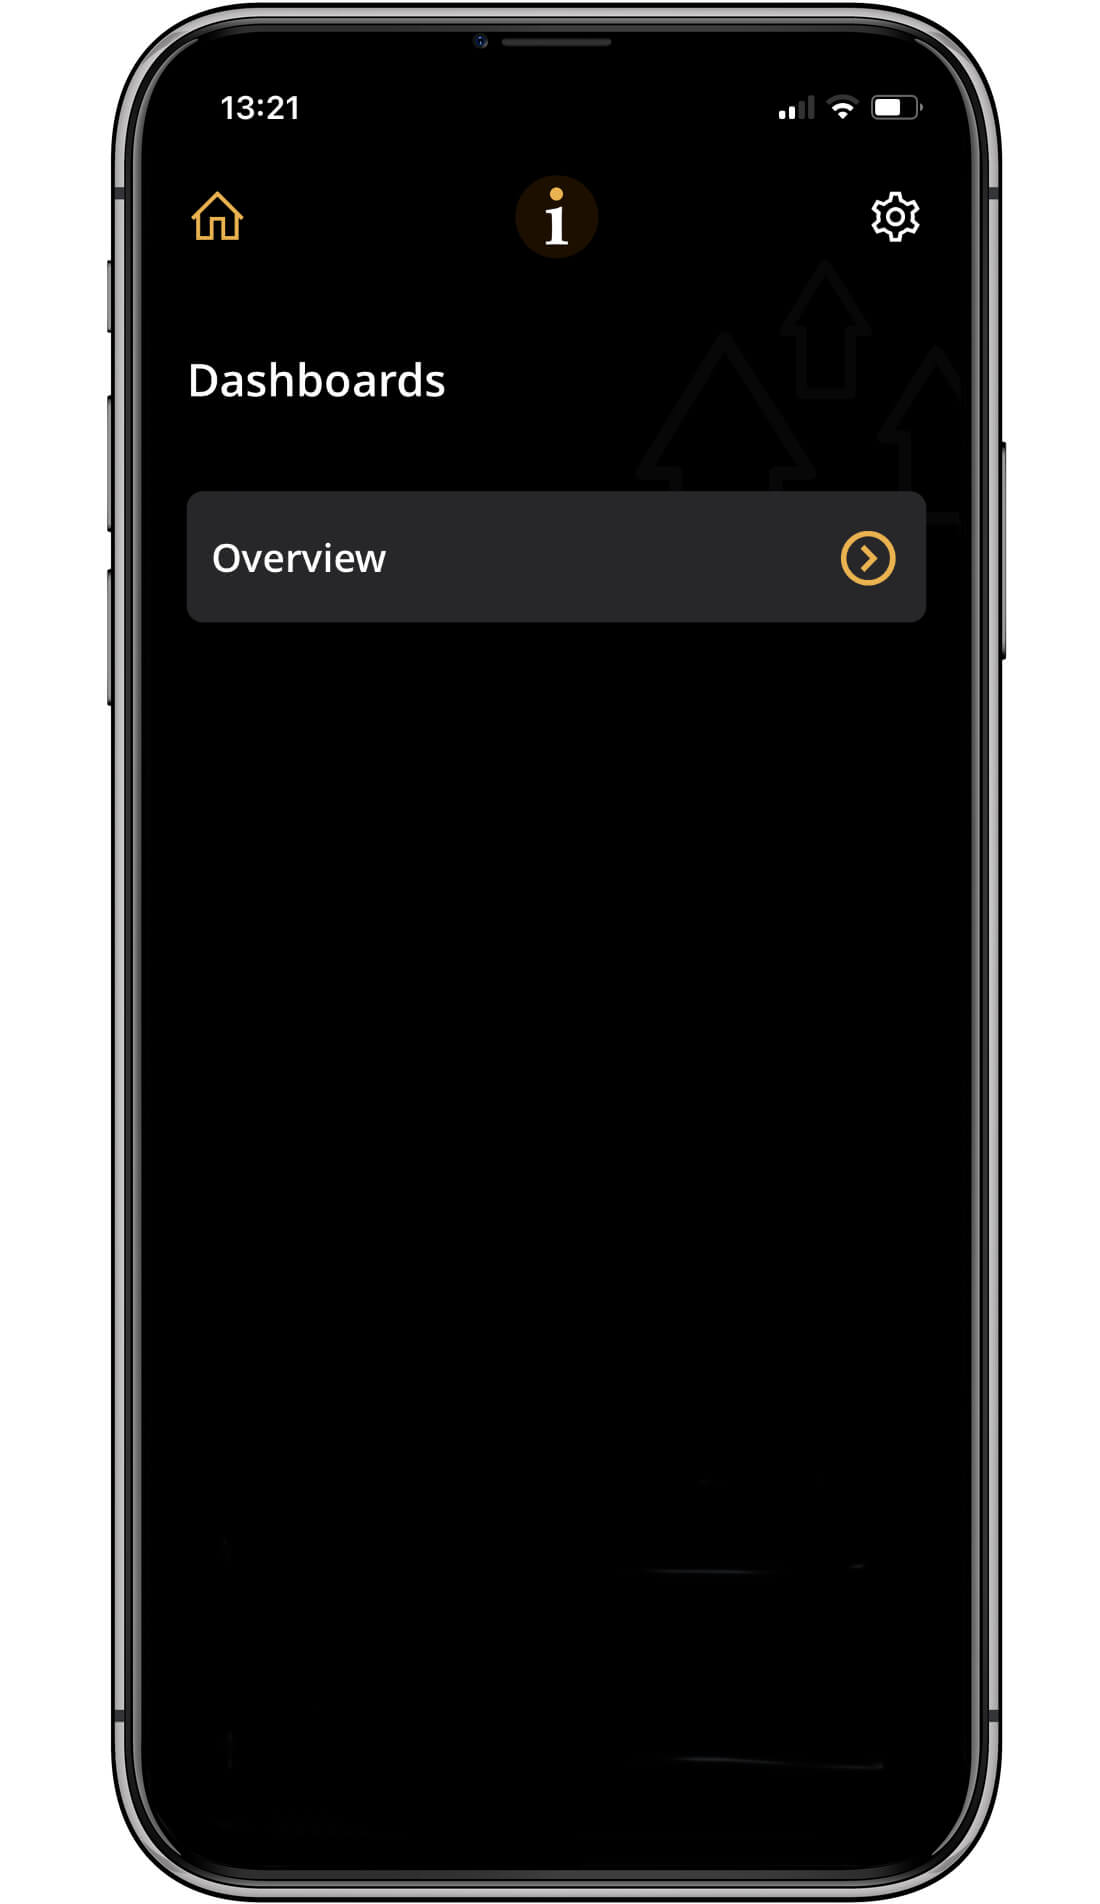
View a dashboard
The dashboard list appears whenever you hit the Home button at the top left of the screen.
To view the KPIs in a dashboard, click on it. So far, you only have one dashboard in your list.
Go to the next step.
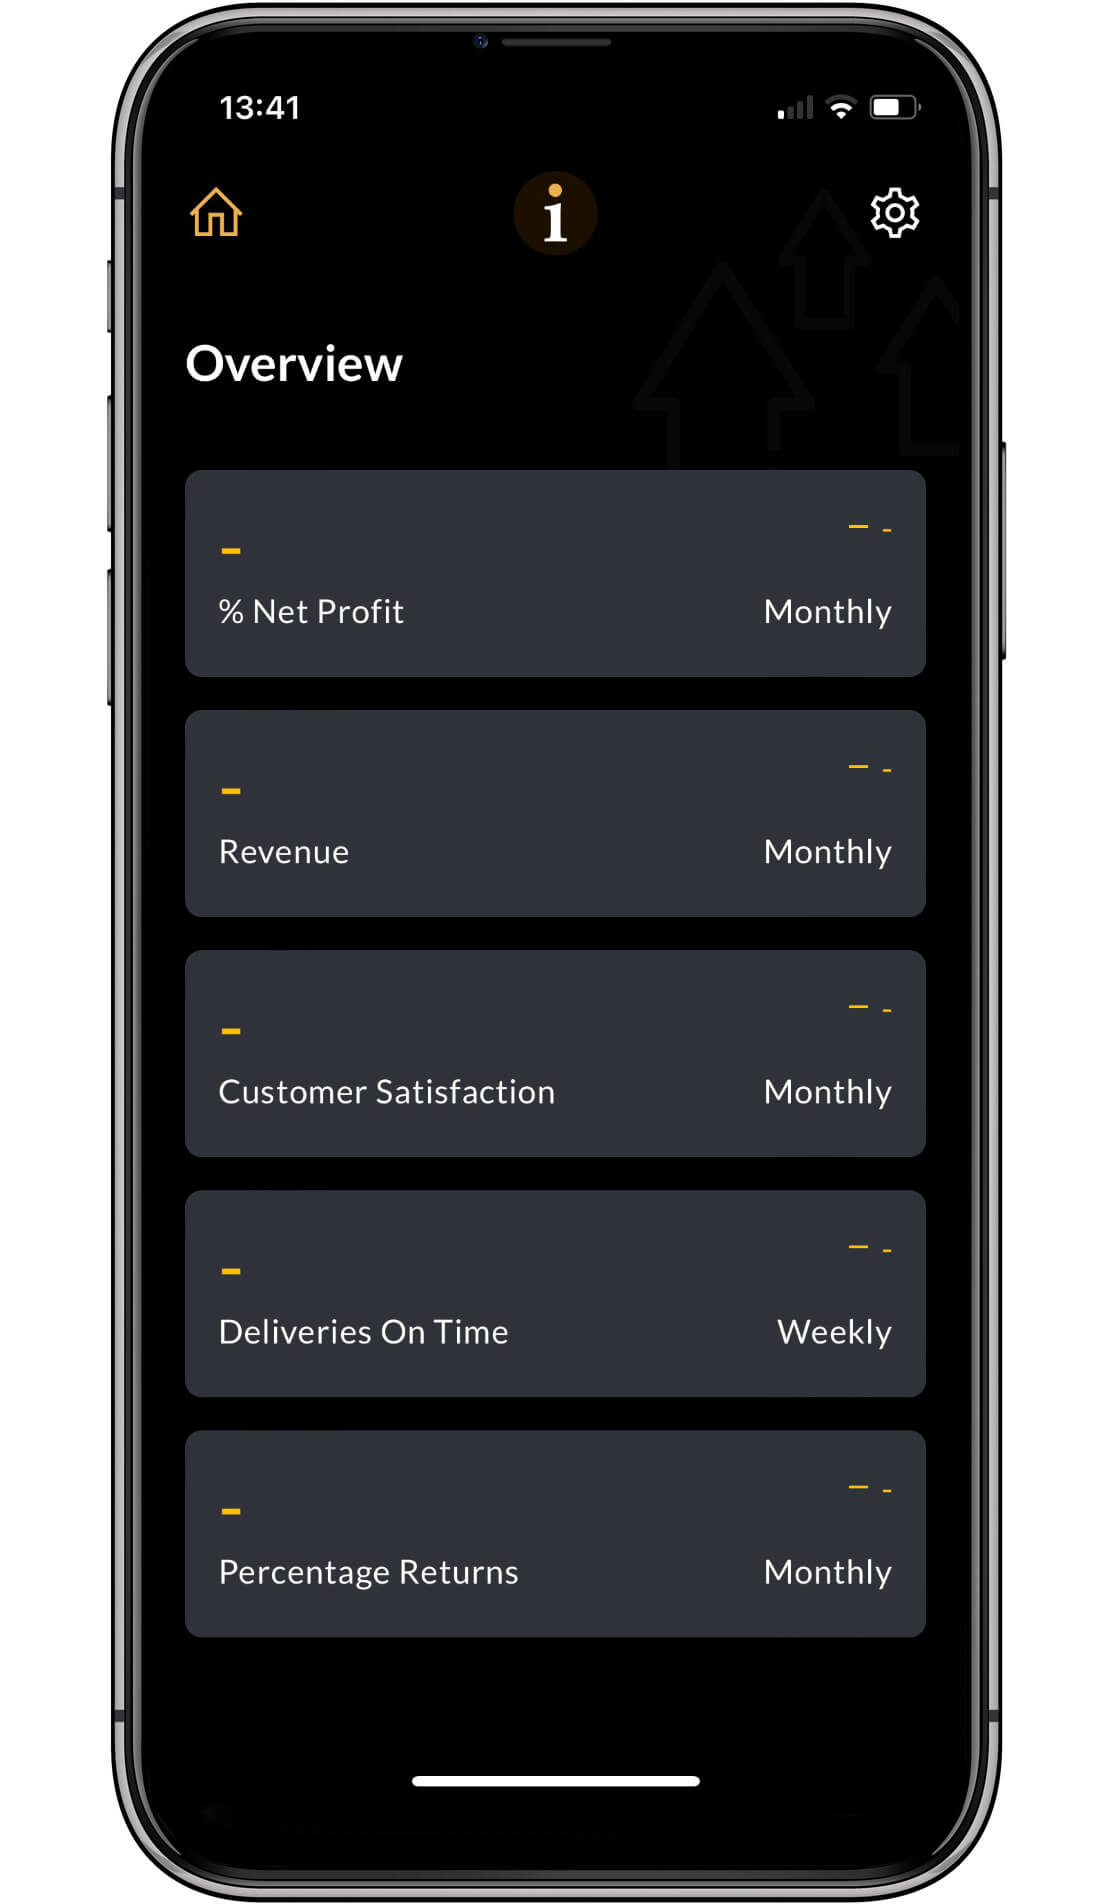
Dashboard with KPIs, but no values added
The example shows the Overview dashboard with the KPIs defined, but the KPI daily, weekly or monthly Actual Values have not been added.
You can add KPI actual values in three ways:
Important Note: The actual values will be uploaded automatically every evening if you link to Google Sheets. This is by far the most efficient way to use the App.
Go to one of the update methods shown above.
