My5 – Add KPI values manually
Add KPI values manually
We added a dashboard and five KPIs manually in the previous user guide.
So far, we have only built a dashboard and KPI structure and added some settings. The dashboard will come ‘alive’ when we add some actual values. That is, the actual values you will be collecting daily, weekly and monthly for your KPIs.
Typically, this process will be automated via a spreadsheet or Google Sheets, but actual values can be added manually.
<<< Watch the Video
Click on any KPI you have defined. We will click on % Net Profit to demonstrate the update.
Go to the next step.

AKPI details screen
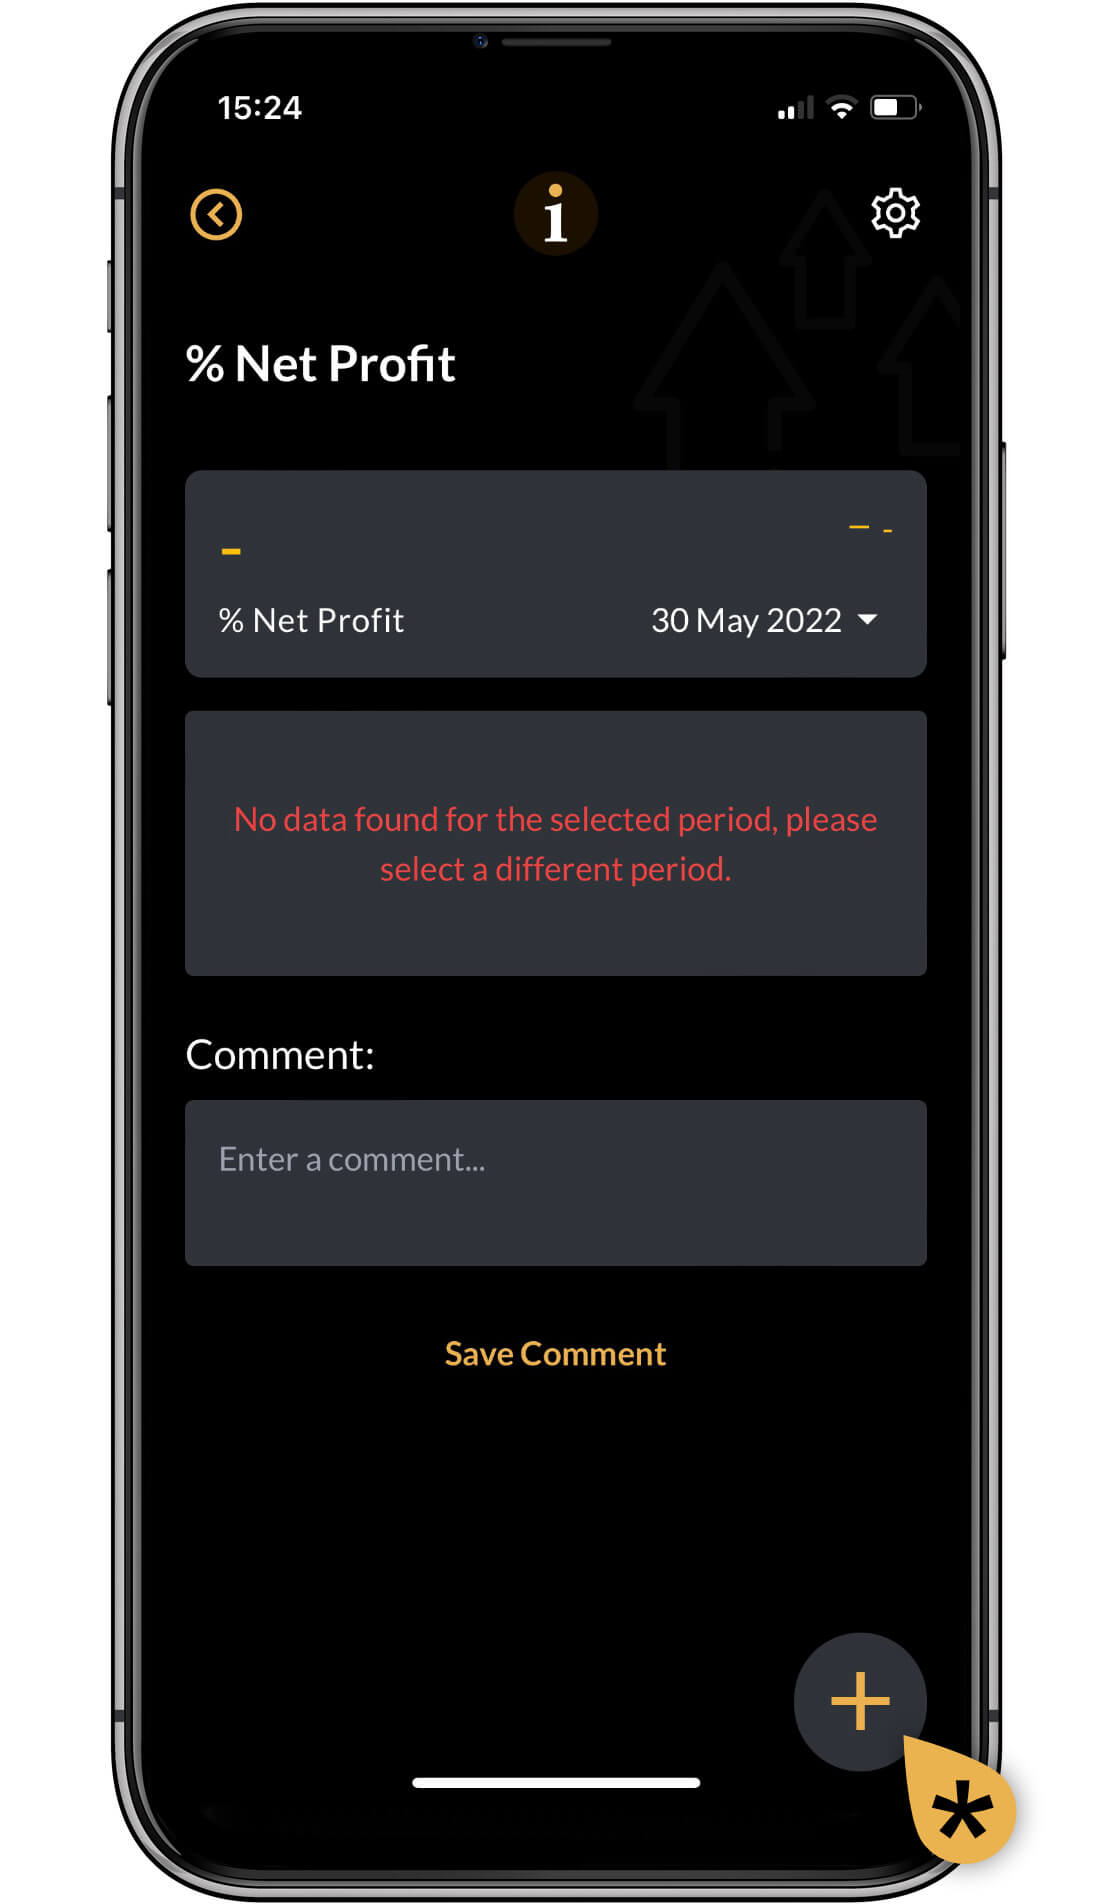
(no data)
A KPI details screen will appear. as you can see from the example, no data has been found for the selected period.
You need to add some actual vales.
Click on the big + icon at the bottom right of the screen.
Go to the next step.

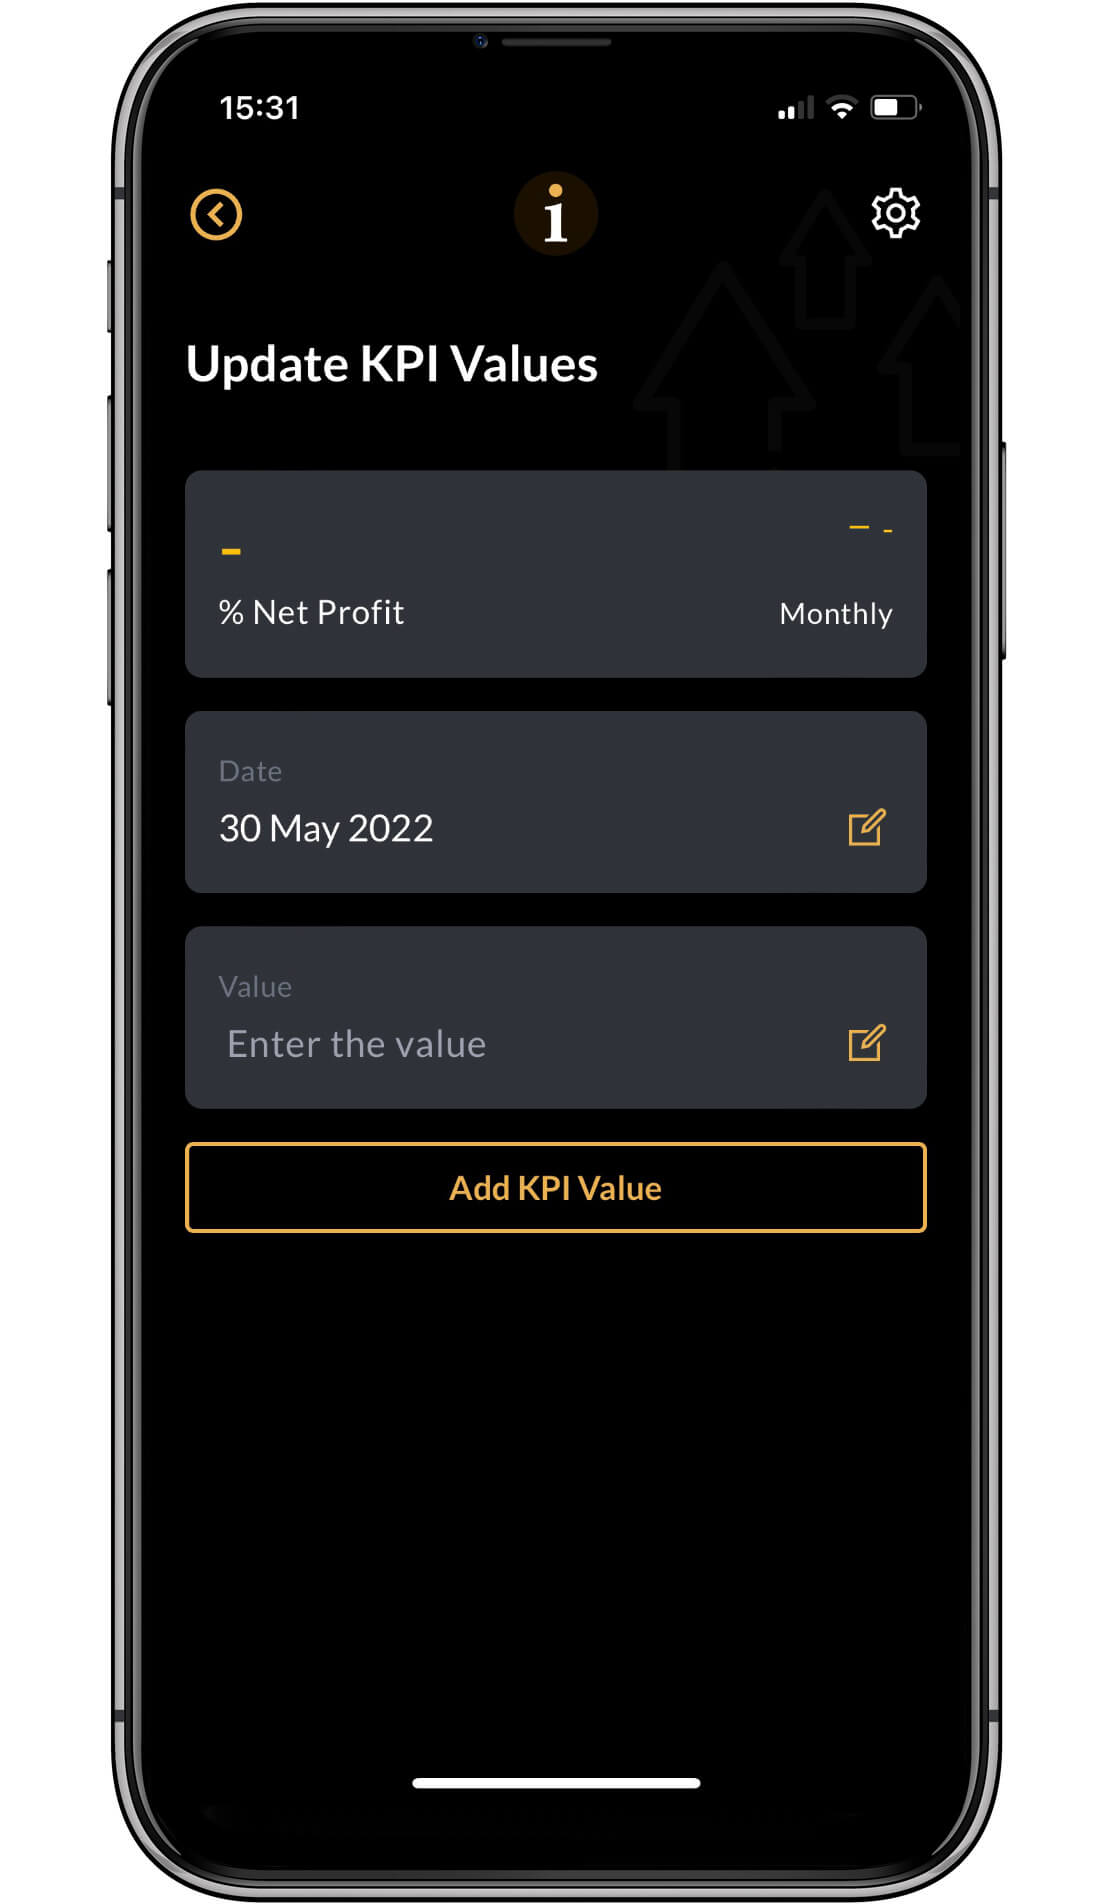
Update KPI Values
Select the date for which you want to update the KPI value. You will need to be cognisant of the reporting period of your KPI, that is daily, weekly or monthly. When you go back to the KPI details screen, it will default to the last day of the reporting period.
Add value and click on Add KPI Value.
The app will return to the KPI Details screen
Go to the next step.

KPI details screen
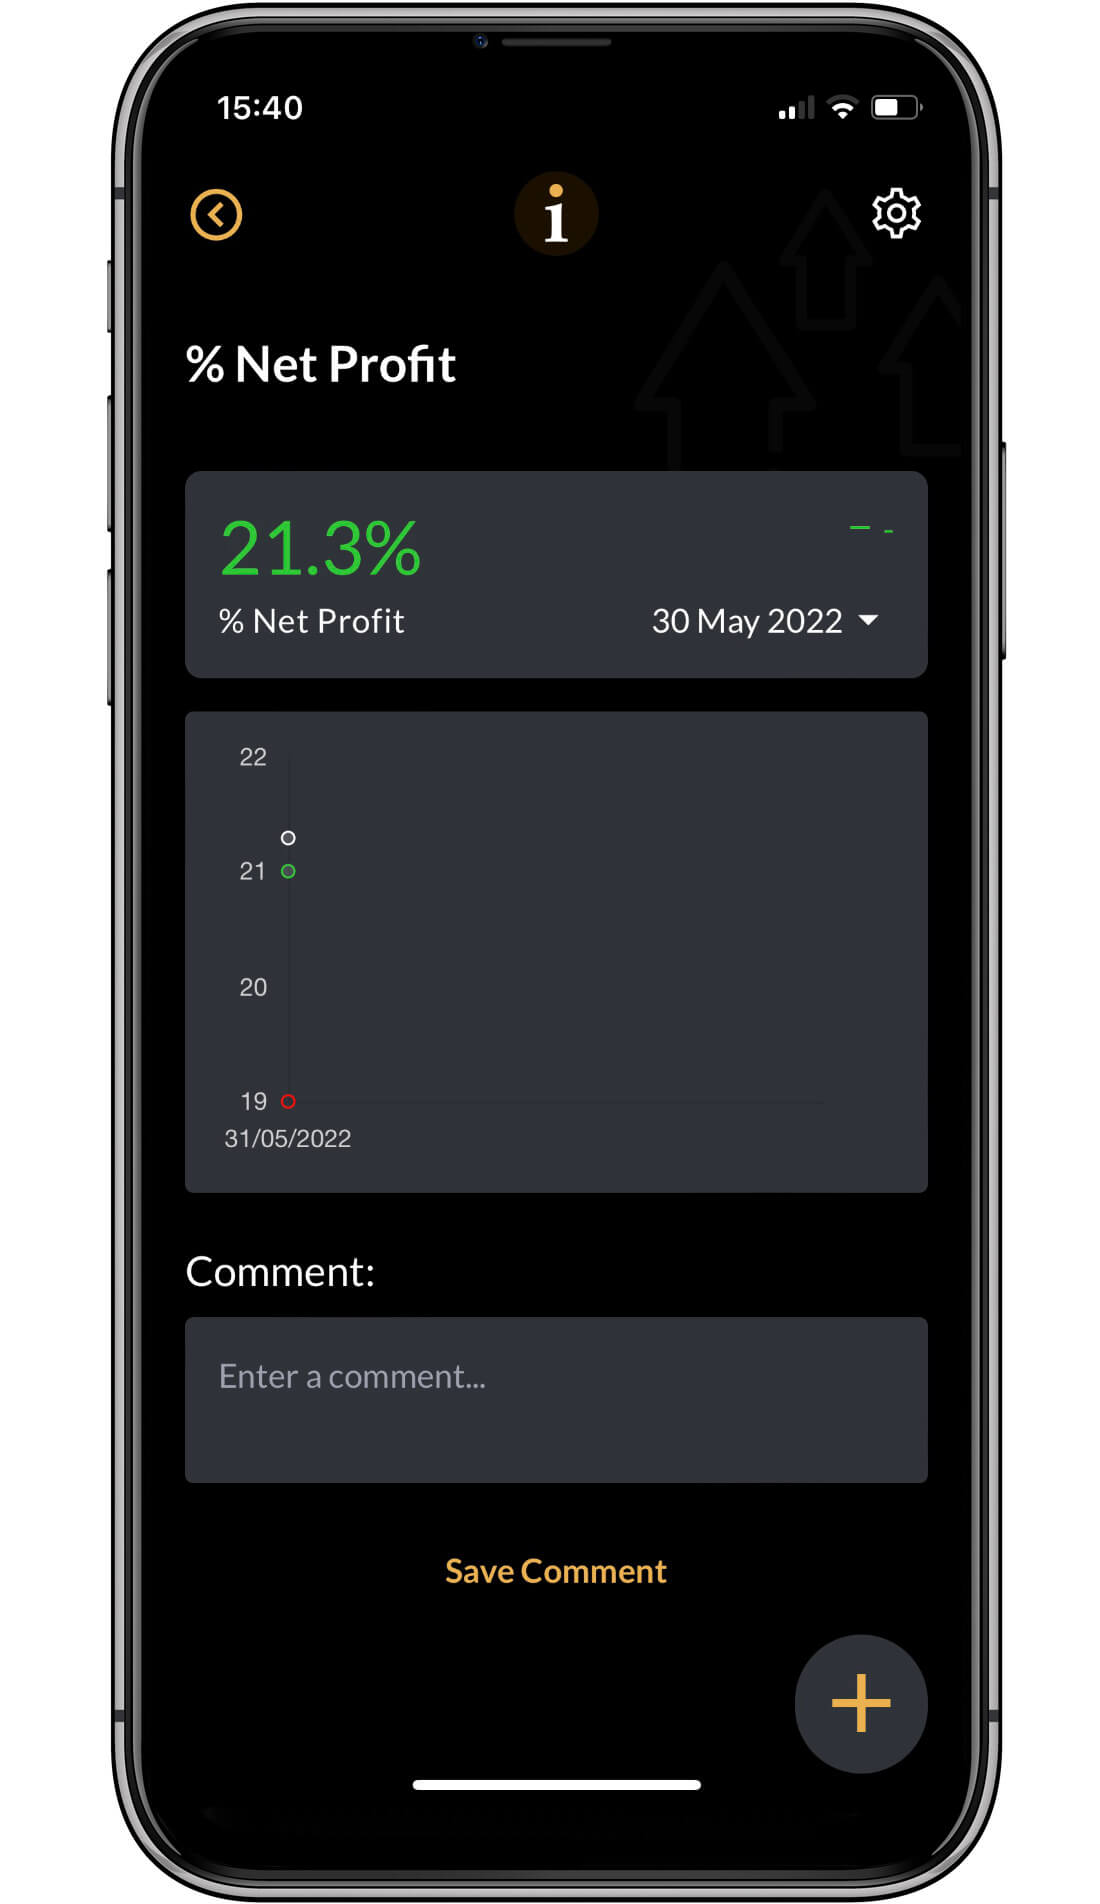
(one value added)
Once an actual value has been added, the app returns to the KPI Details screen. In this example you can see that a value of 23.3% has been added, that is is above the target of 21% and is therefore showing green.
The variance indicator is not showing a value. The variance indicator will show a percentage change from the last reporting period. Therefore, some historical data needs to be in place for this to work.
Go back to the previous step, change the date, and add historical data.
You can see a typical result in the next example screen.

KPI details screen
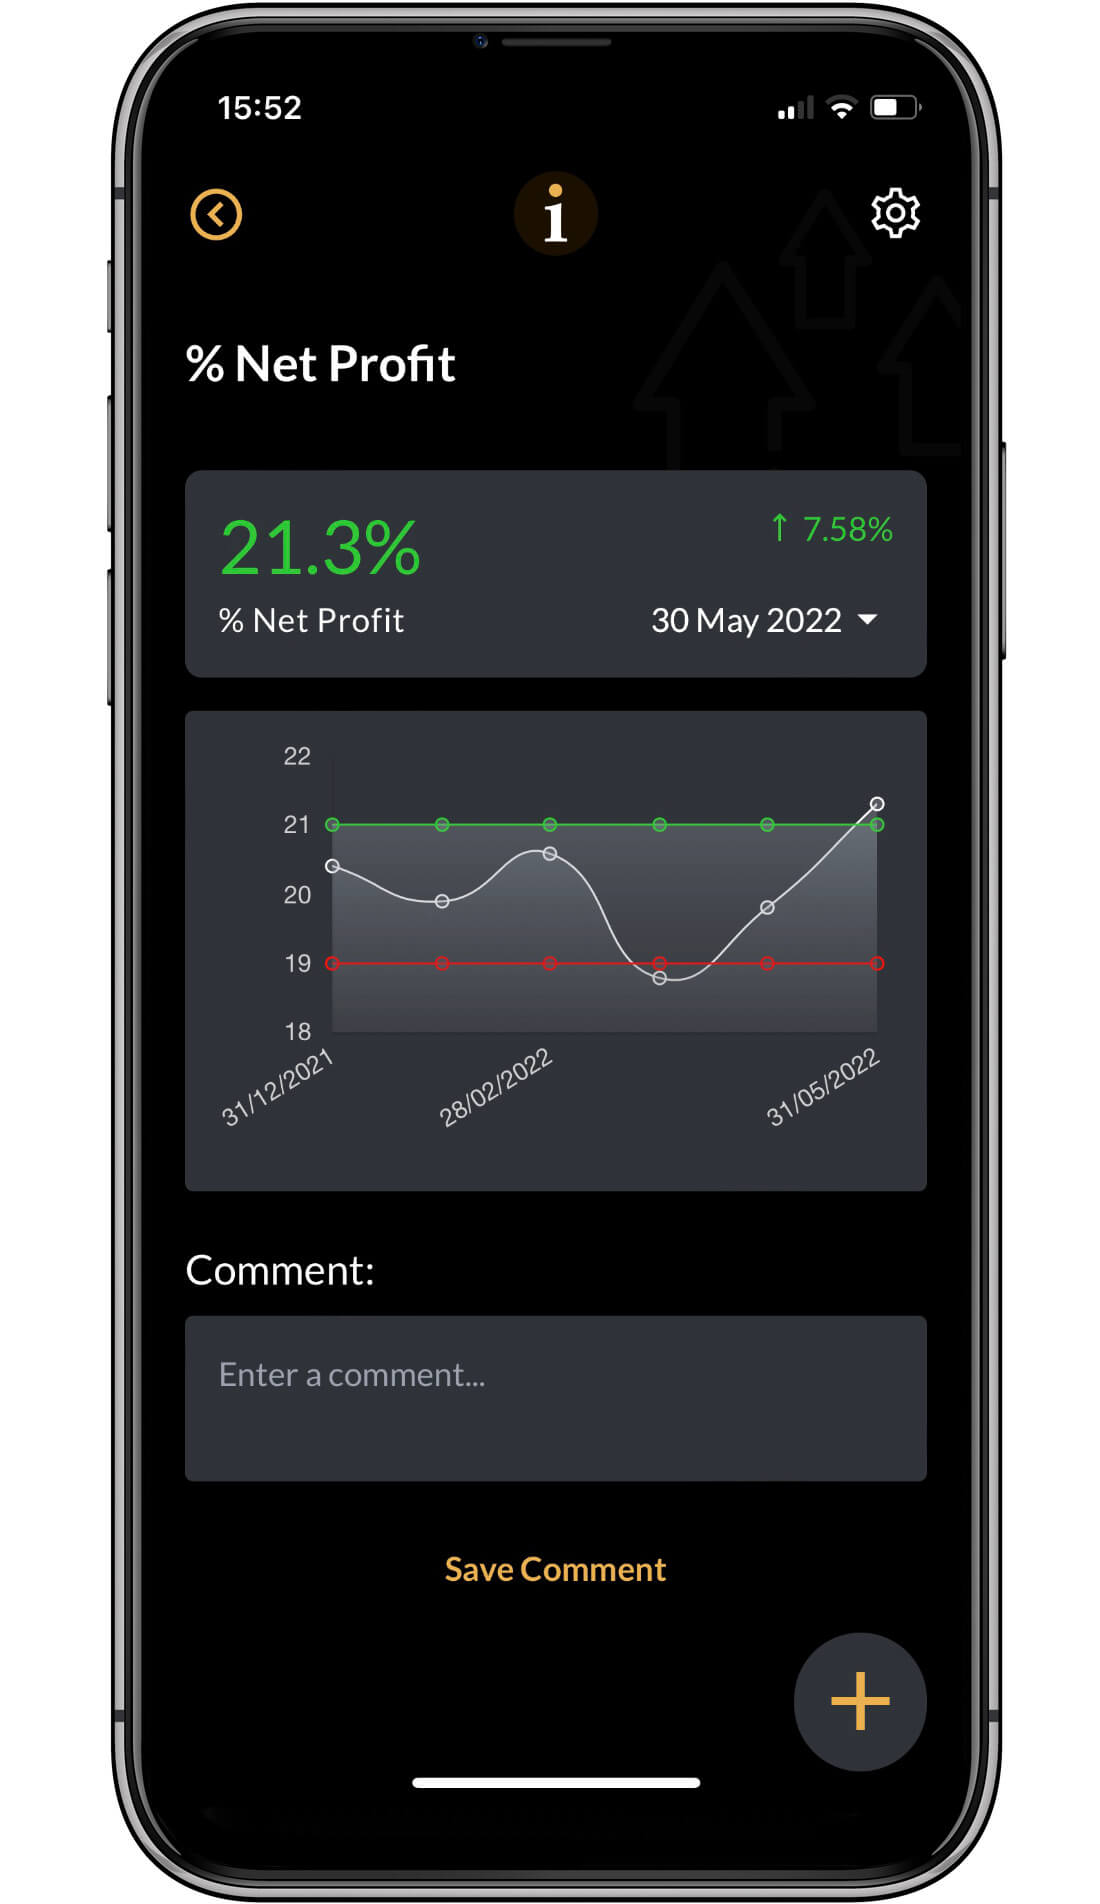
(historical data added)
The KPI details screen will show up to six periods previous to the date selected (if the data is available.
For monthly data, this will be the previous six months.
For weekly data, this will be the previous six weeks.
For daily data, this will be the previous six days.
The comments box will show comments specific to a reporting period.
