The application has a ‘calculation’ function for any Measures you create in your Scorecard. Often you may find you need to calculate an actual value and/or the red/amber/green threshold values. A simple example might be summing up the actual values of several revenue streams to provide a total.
For the purpose of this guide we will sum the Actual Values and Thresholds of three separate revenue measures in a fourth measure called Total Revenue.
First you need to create the Measure called Total Revenue. Go to the Scorecard where you want the measure to appear and create it. Do not give it any Threshold Values.
(If you need help creating a Measure go to the Creating Measures guide)

Click on the Overview tab. The result should look something like this:

Click on the Edit tab to open the Measure. Configure the details in the top two panels as you normally would when creating a Measure.

In the Series Detail panel click on Actual Value and select Calculated from the from the drop-down list.

Do the same for Red Flag and Goal. The result should look like this:

Click on Set Equation under Actual Value and the equation dialogue will appear.

The box and drop down menus have the following functions:
- The Equation Box – marked as Actual in this example. This is where the calculation takes place. Think of this as being like a spreadsheet cell. Many of the operands and functions you can use in a spreadsheet can be used here. A full list of operands and functions is at the end of this document.
- Type – You can use; Measures, Scores, Initiatives and To Dates in your calculations. Measures and Scores are fairly obvious, for more information on Initiatives and To Dates go to the end of this document.
- Measure – This will change depending on which Type you select.
- Series – When you select Measure this will give you the option to select the Actual Value, Goal or Red Flag.
- Period – You can select Current or an Earlier or Later period.
- Add – You need to click Add to add the Measure to the Equation Box.
Step 1
Click on Select Measure in the Set Equation dialogue box.

Step 2
The Organization tree will appear. Select the Scorecard and Measure you want to include in the calculation.
In this example we have selected Product Revenue.
Click the blue Done button.

Step 3
The Measure appears in the Set Equation dialogue.
Click the blue Add button to add it to the Equation Box (under Actual Value).
The unique identifier appears in the box.

Step 4
Place the cursor next to the unique identifier in the equation box (it will appear inside the unique identifier).
Hit the + key. The + sign will appear next to the unique identifier.

Step 5
Click on the Measure drop down box again and the Select a Measure dialogue box will appear again.

Step 6. Select the next measure you need for the equation. In this example we have selected Training Revenue.
Click the blue Done button.

Step 7
The new measure appears in the Set Equation dialogue under Measure.
Click the blue Add button to add it to the Equation.

Repeat the steps to add the third and final term (‘Book Revenue’ in this example)
In our example, the final equation looks like this.
Click the blue Done button.
VERY IMPORTANT: Click Save in the Edit panel to save the calculation.

After clicking Save, you will see a red warning appear at the top of the screen.
This is because, in this example, you need to add an equation for the Red Flag and the Goal as well.

Red Flag and Goal Equations
Repeat Steps 1-7 for the Red Flag and Goal.
During Step 3 select Red Flag or Goal from the drop-down called Series.

In our example, the Red Flag equation looks like this.
VERY IMPORTANT: Click Save when you return to the edit screen to save the calculation. Then click Overview.


Top Tip
To check that your equations are correct you can look at all of them in the same place buy clicking on your metric and then clicking the information button at the top right of the screen.
In our example, the information looks like this:

Supplementary Material
Operands
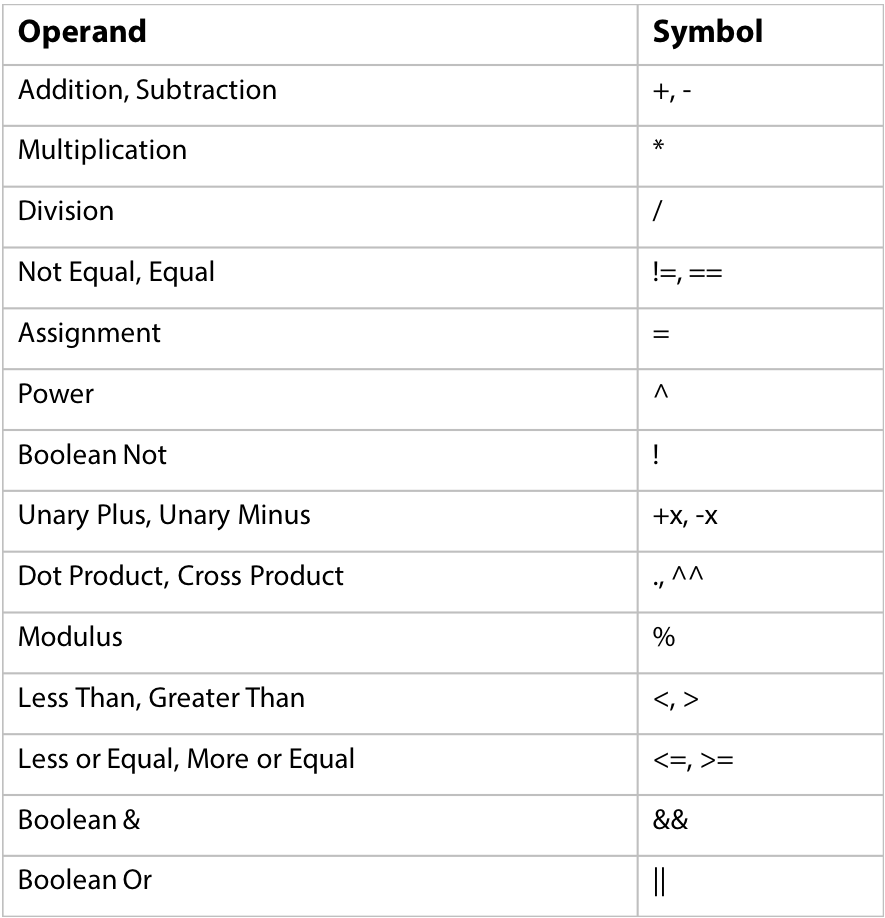
IMPORTANT NOTE: When using the operands below, you may need to use a double = (e.g. ) when checking for an ‘equal’ value. A distinction has to be made between ‘assigning’ a value (=) and comparing a value ().
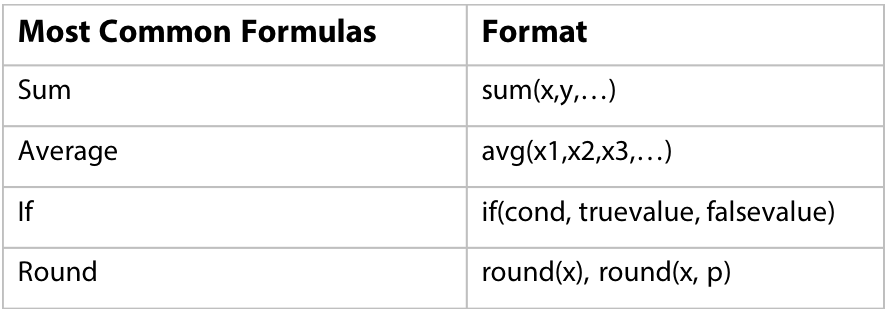
Most Common Formulas
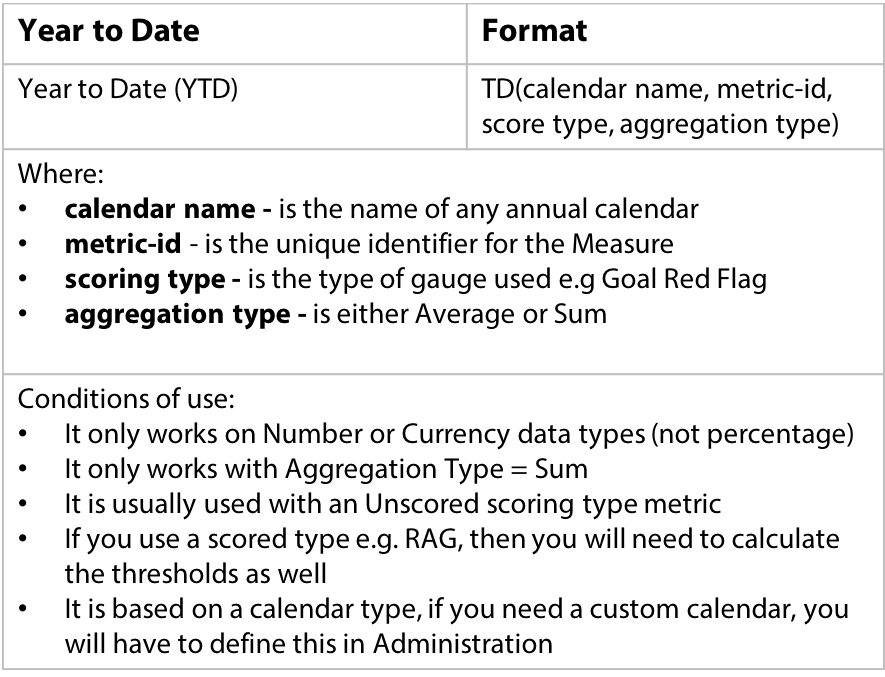
IMPORTANT NOTE: In Version 3 of the application the Year to Date calculation can be constructed using a point-and-click drop down set of menu items. The resulting format is the same, but there is no need to construct it by hand.
Initiative Functions
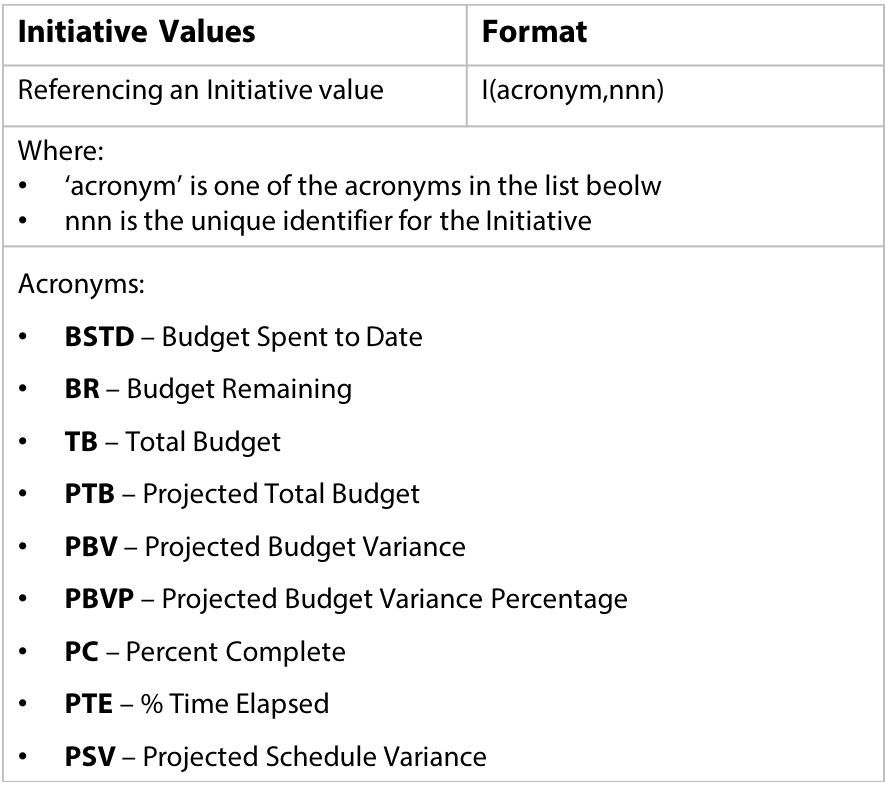
A real example would look like this:
- I(TB,1001) (where “TB” is the acronym for Total Budget and 1001 is the Initiative ID value)
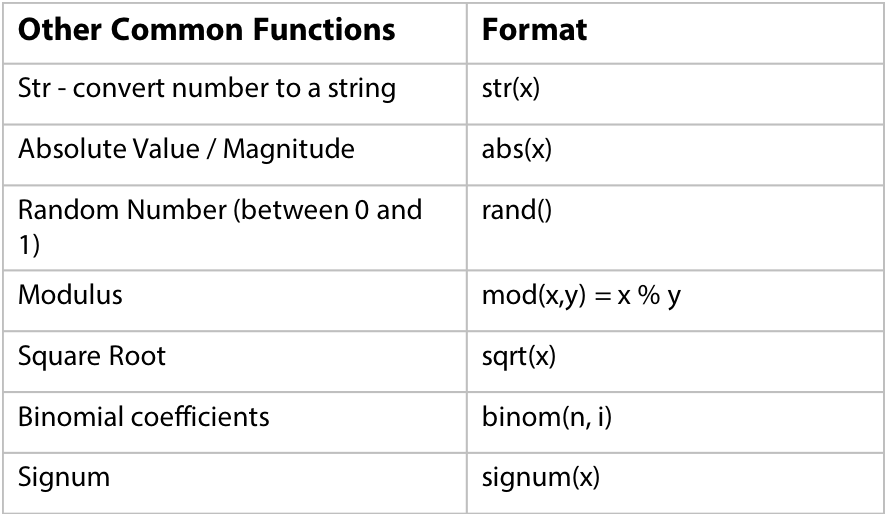
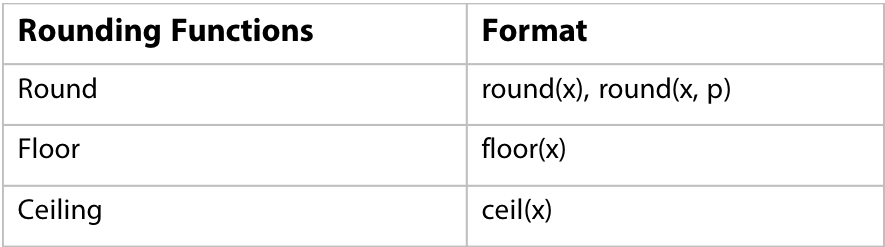
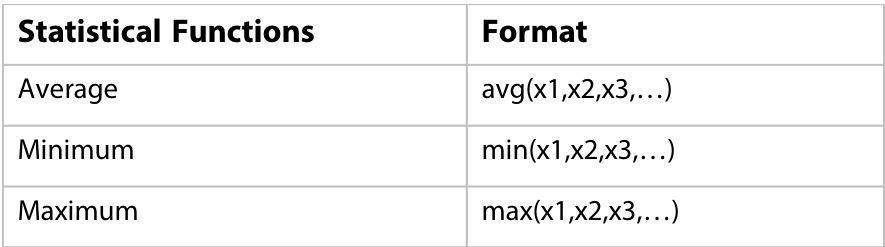
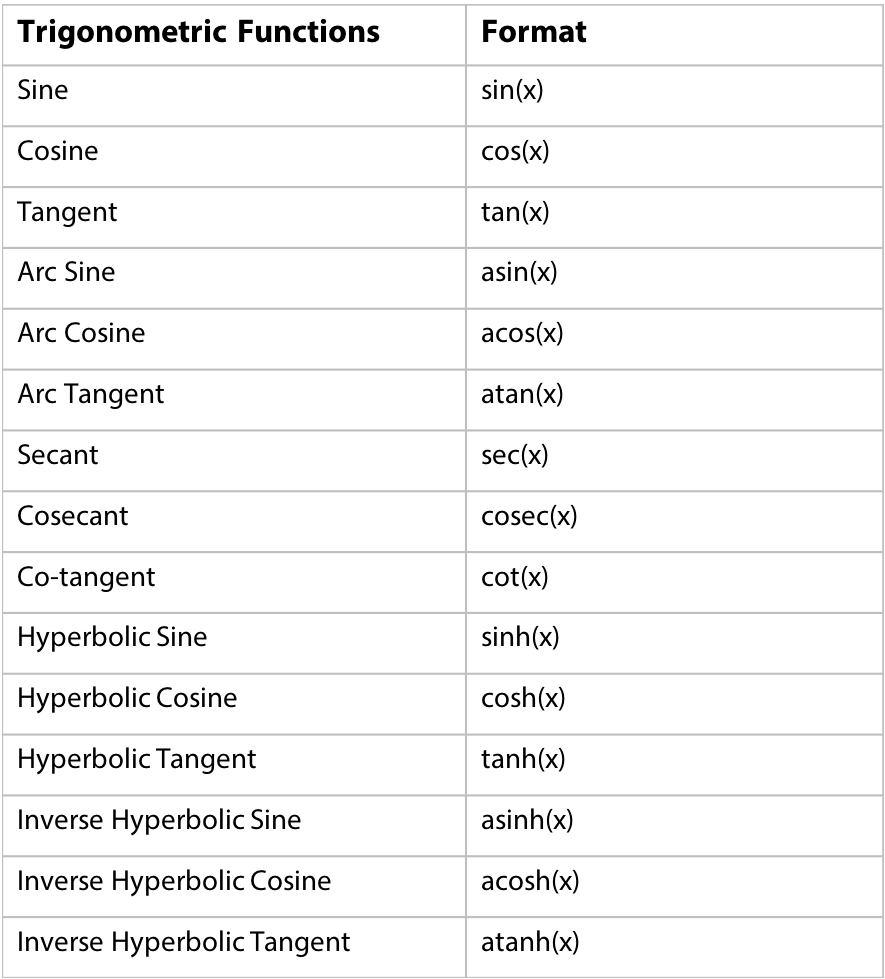
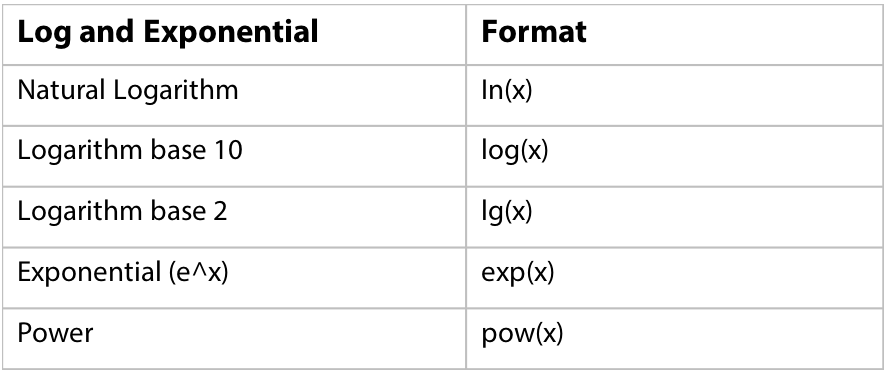
Functions