
There are two parts to setting targets for Measures in the application:
- Updating the ‘goal’ and ‘red flag’ threshold values
- Adding an additional target line to the graph
1. Updating the Goal and Red Flag Threshold Values
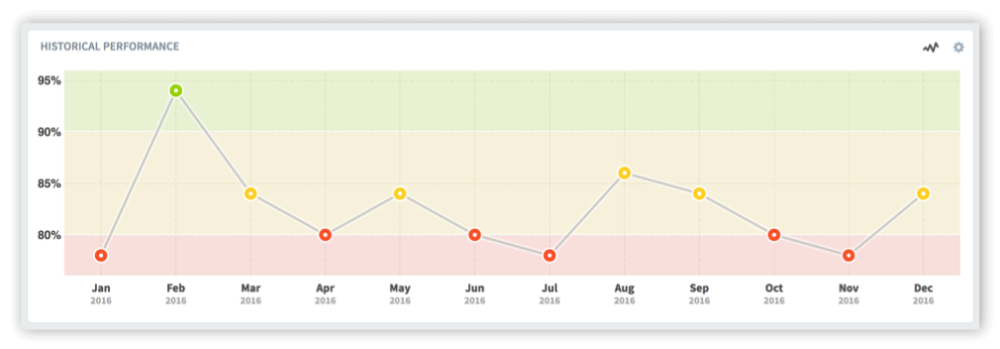
When measuring continuous improvements in a performance management system, the monthly goal and red flag values usually remain the same for the performance management cycle as can be seen in this example:
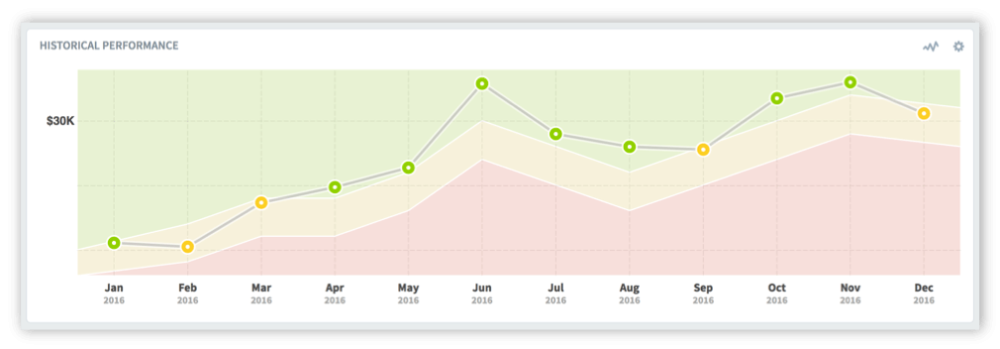
However, there are times when the performance measure has a specific target for each month. Typically, revenue or profit measures might look something like the example below.
Both the goal and red flag threshold values need to be updated when they change. This can be achieved by going to every month and manually changing the values. However, this does not provide much flexibility and is a very tedious approach.
Using a reference sub-Measure
A much better way is to add a ‘target’ Measure and use this as a reference.
First, click on the Measure you are interested in and create a sub-Measure using the ‘unscored’ Measure type.
The result should look similar to the example on the right where we have added Net Profit – Target.

We are going to add all of the monthly targets for the following year in one go.
Click on the Date tab and select the Yearly view that you are interested in.
Click on Show Results.

The whole year will appear in the panel Actual and Threshold Values.
Click on the pen icon at the top right of the panel.

The Edit dialogue will appear. You can now add each monthly target for the entire year.
These targets will be used to build the threshold values and the target line in the Measure you are interested in.
Note: This is a sub-Measure. That is, it resides under and tiered to the right of an exiting Measure. As such, it will not contribute to the scores in this Scorecard tree.
Click Save.

Click on the Measure you where you want the target to appear, in this case Net Profit.

To reference the target Measure we have just created we need to edit this Measure. Click on Edit at the top left.

The edit dialogue appears. Click on both the Red Flag and the Goal drop-down menus in turn and select Calculated.

Click on Set Equation under Goal and the equation dialogue box will appear.

Click on Select a Measure.

The Select a Measure dialogue will appear. Click on the Scorecard on the left and the target Measure you have just created on the right.
In this example we have highlighted Net Profit – Target.
Click Done.

The target Measure together with its unique identifier appear in the measure box.
Click on Add and you will see the target Measure as the Goal for this measure.
Click Done.

Click on Set Equation for the Red Flag.

Go through the same process, but this time we are going to set the value as 1% lower than the target.
The correct equation reads:
M(51)–(M(51)*0.01)
where M(51) is the target value and 0.01 is 1% as an actual value.

There is one VERY important last step. So far you have been clicking a Done button.
You now need to click the Save button!

Click on the Overview tab at the top of the page and you should see something like this:

As you can see, by using equations based on your target Measure, the thresholds now vary month on month.
2. Adding a Target Line (optional)
You may want to add a target line to your historical performance graph.
Click on the small configuration cog at the top right of the line graph.

The Edit Chart dialogue appears.
Click on Add Series.
The familiar Choose Item from an organization dialogue will appear. Select Net Profit Target.
Your selected Measure will appear in the list. You can change the colour of the line if you wish.

The result will be something like this:

The background thresholds can be removed from view by clicking on the configuration cog at the top right of the graph. You should see something like this:
