Spider Impact tracks three types of performance data:
- Scorecards measure the same things over and over. They’re all about setting goals for KPIs, and then using that information to see how you’re performing with your big-picture strategy. The KPIs you measure this year will usually be the same KPIs you measure next year.
- Initiatives are temporary. They have start and end dates and usually last less than 18 months. You put initiatives in place to fix the problems you find in the Scorecards section.
- Datasets track unstructured raw data that isn’t scored. They’re the business intelligence layer underneath your strategic management. You can analyze and report on dataset data directly, and you can aggregate dataset data to power KPIs in the Scorecards section.

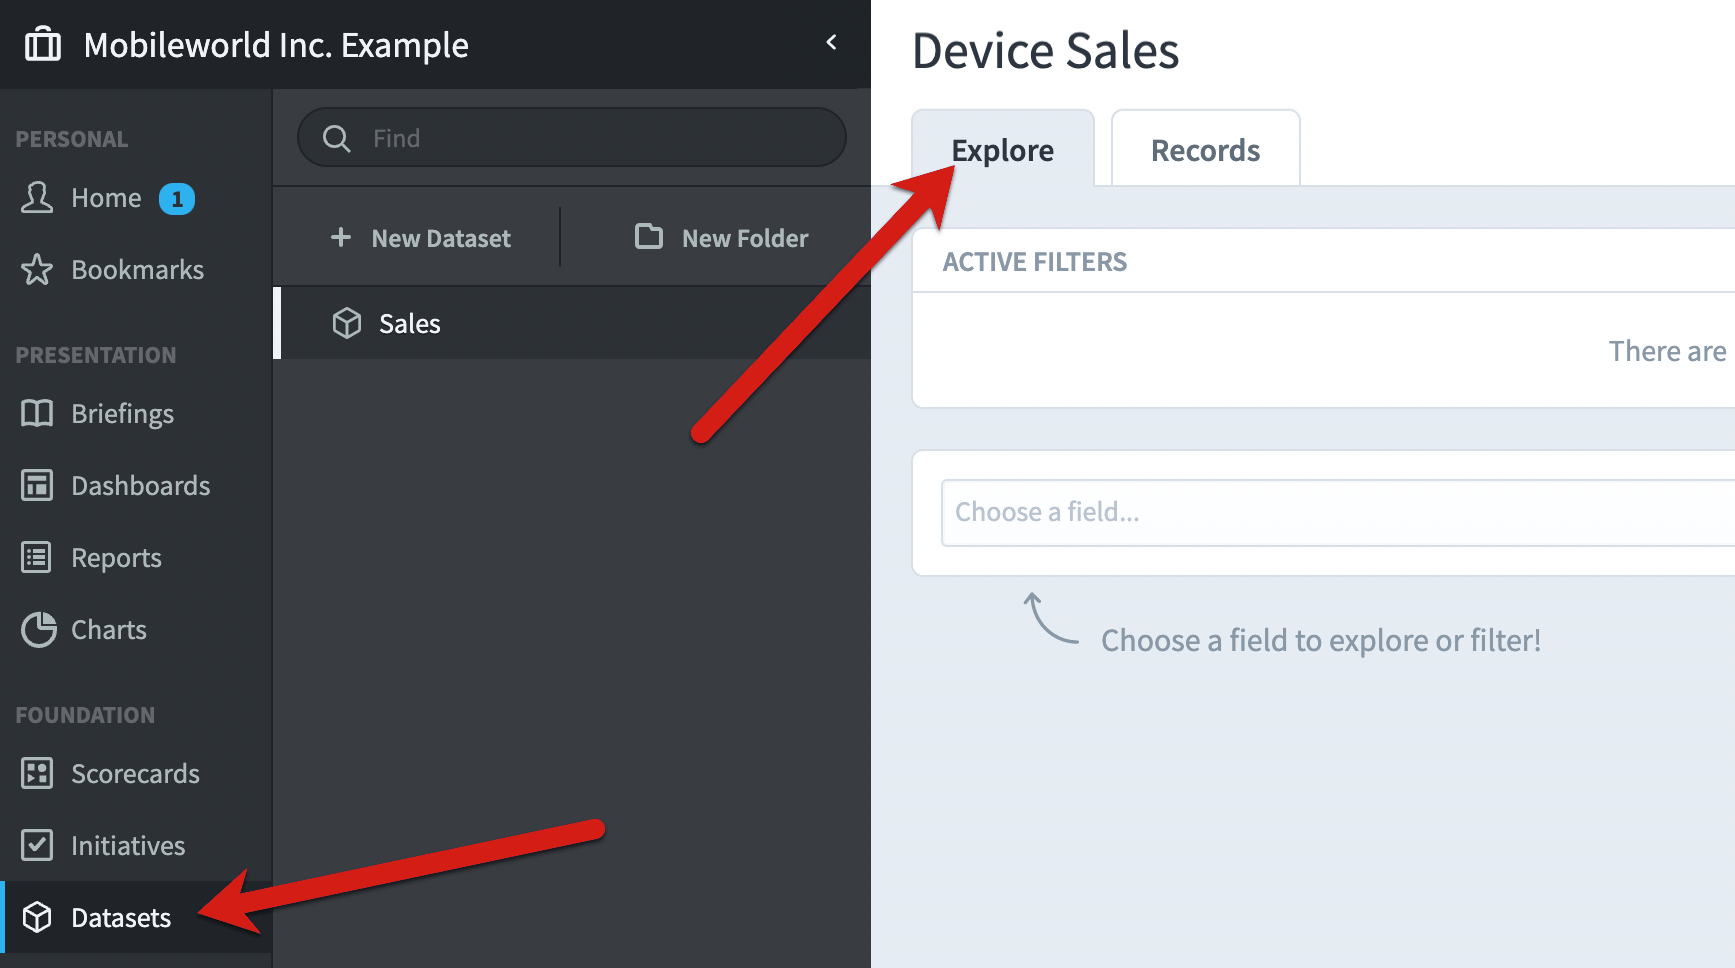
Here we’ll focus on Datasets. We’ll cover how they’re used, and what makes them such a powerful addition to Spider Impact.
The Explore tab
The Datasets section is great for exploring your data and quickly answering questions. It’s all about slicing and dicing your data on the fly to get the answers you need immediately.

It’s important to keep in mind that the Datasets section is not a presentation tool. It’s the place where you store and explore all of your data. When it’s time to show your dataset data to other people, the Dashboards, Charts, and Reports sections have everything you need.
Viewing and filtering fields
We’ll start with a Device Sales dataset. It contains information about the 29,085 devices our company has sold. At this point we don’t know much about the data, so we’ll start to explore.
To choose a field to view, click on the field menu.

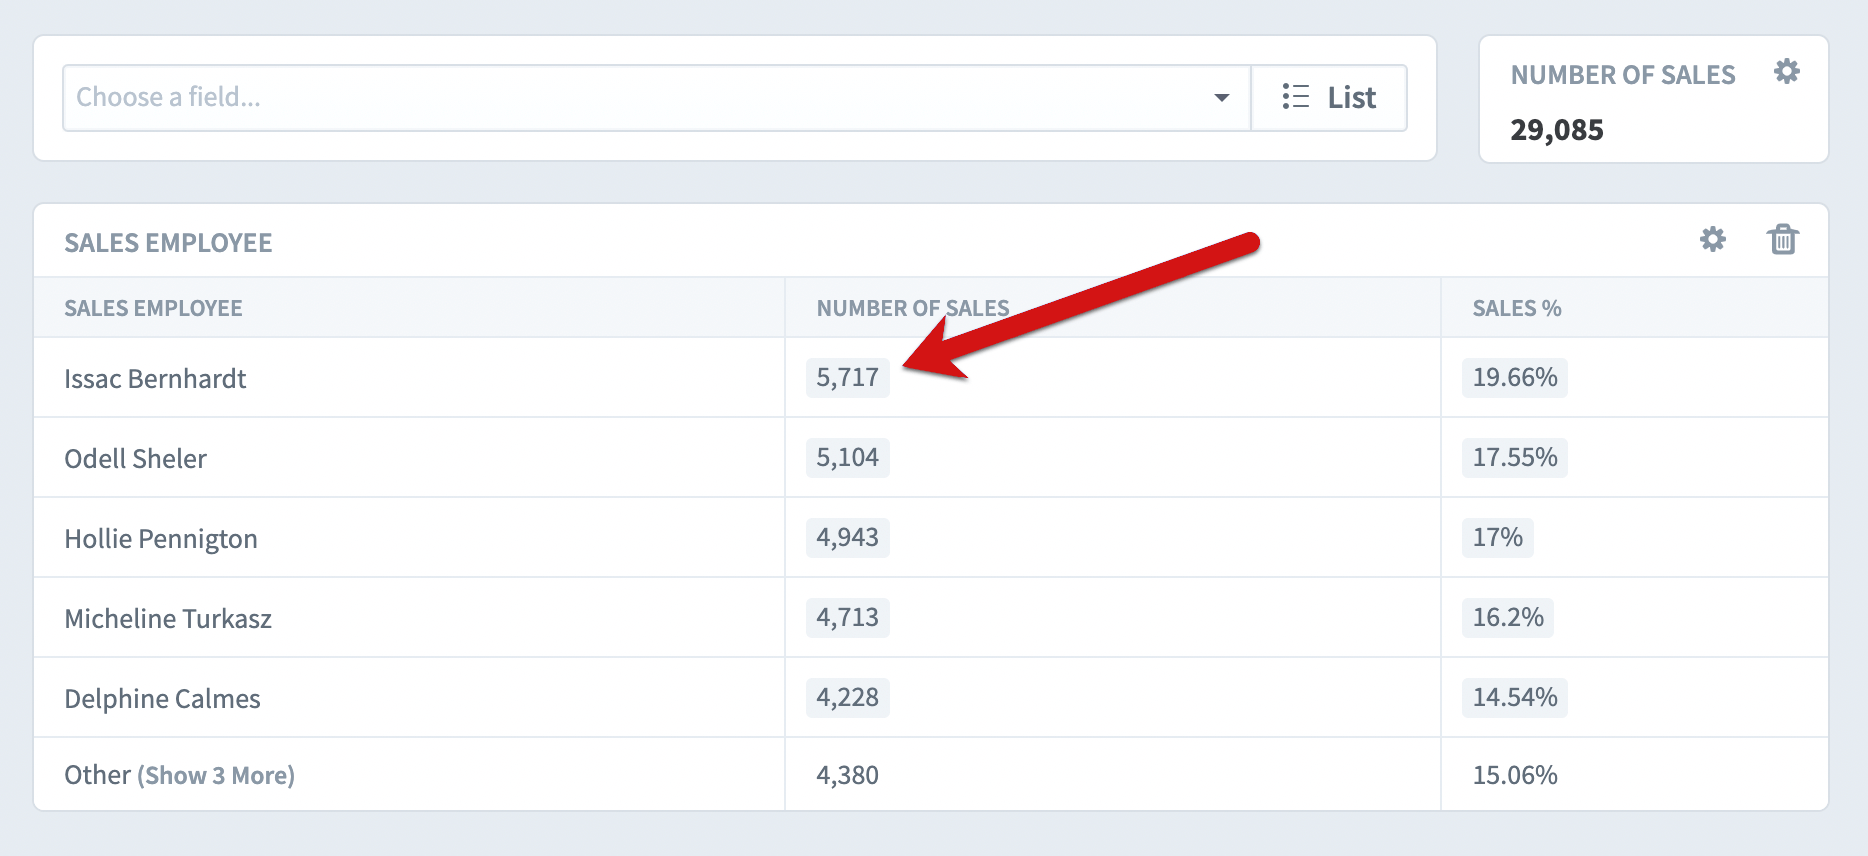
This lists all of the dataset’s fields. As you can see, there’s information about things like the sale date, the price, and the customer. We’ll chose Sales Employee.

This adds a table breaking down all of the sales in this dataset by sales employee. Issac Bernhardt is in the lead with 5,717 sales.

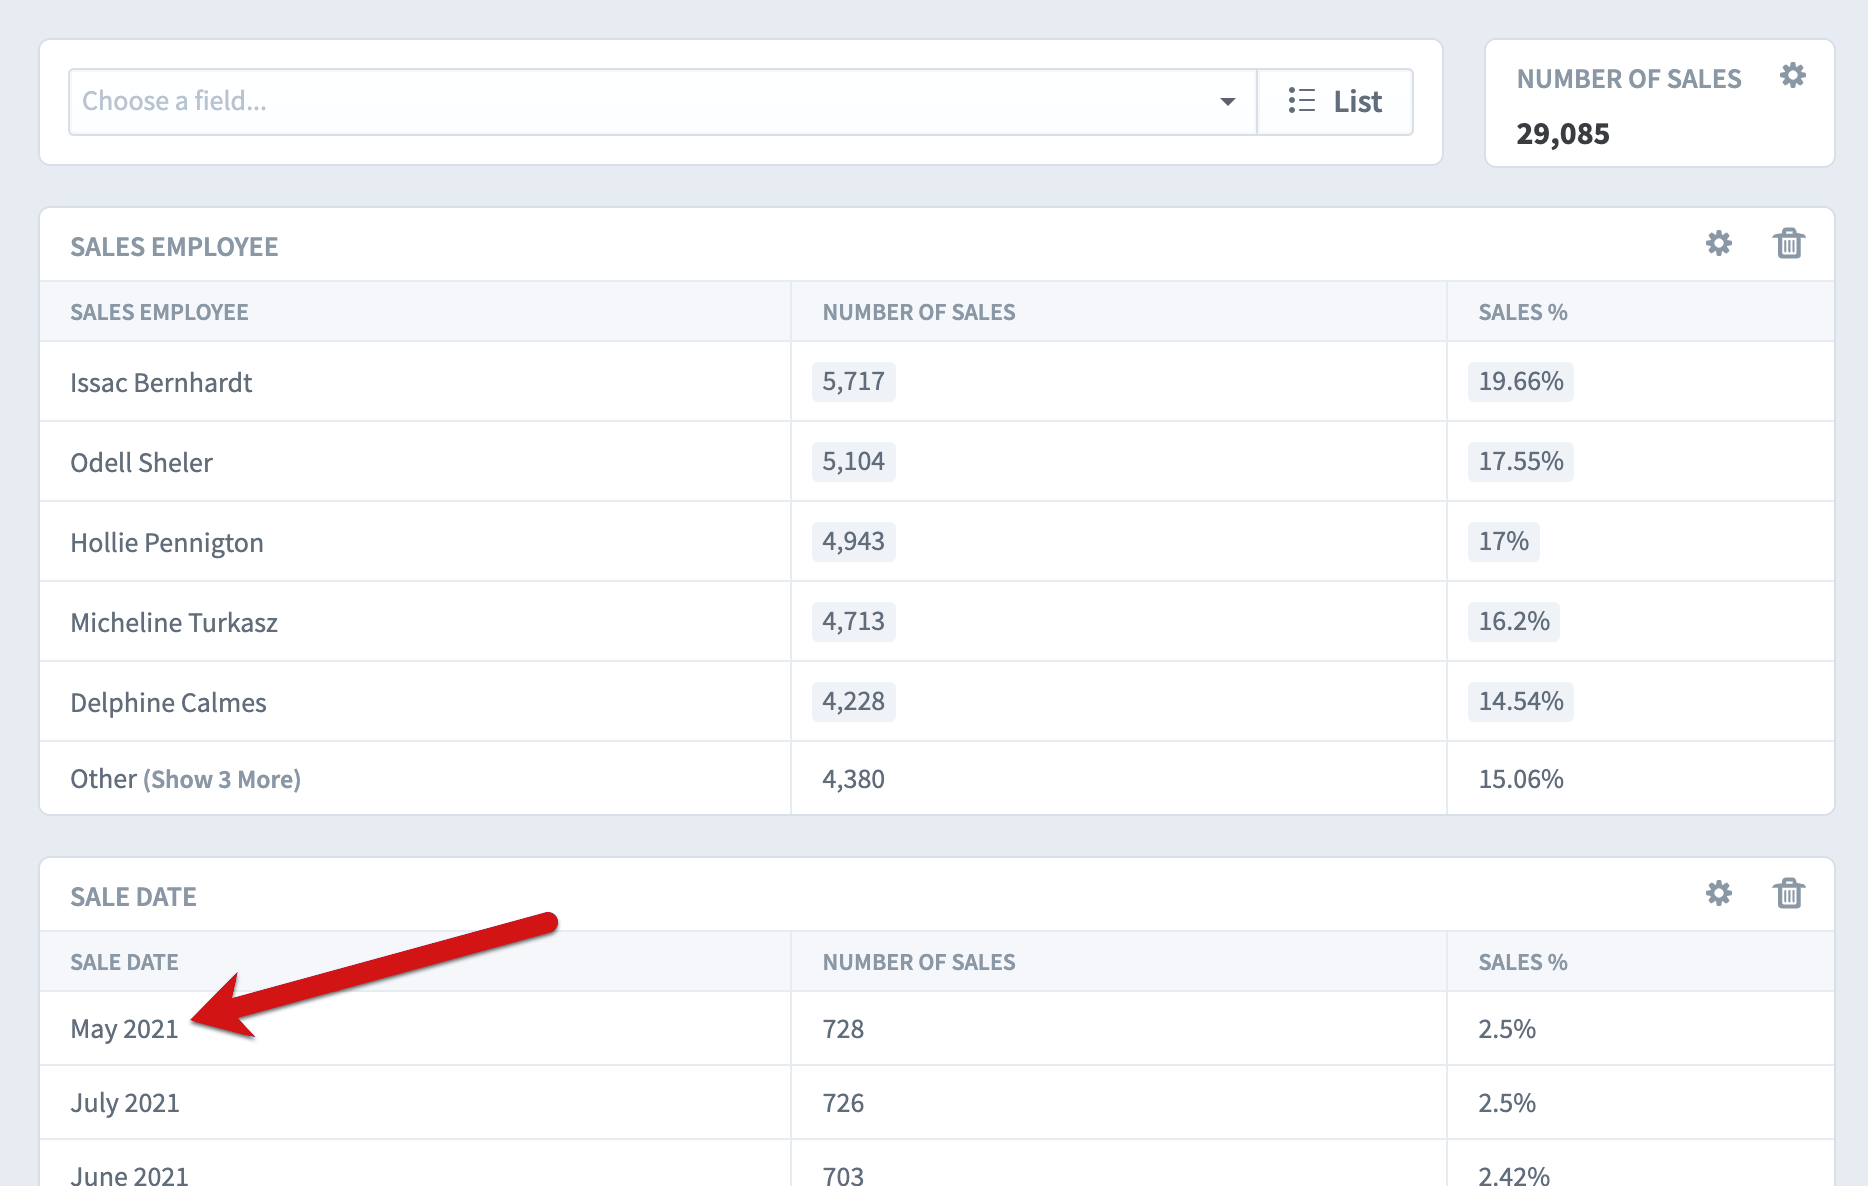
Next, we’re going to choose the Sales Date field in the main field menu. This adds another table that breaks the sales down by date. As you can see, May 2021 was our best sales month.

If we want to see only the sales for May 2021, we can just click on that row in the Sale Date table.

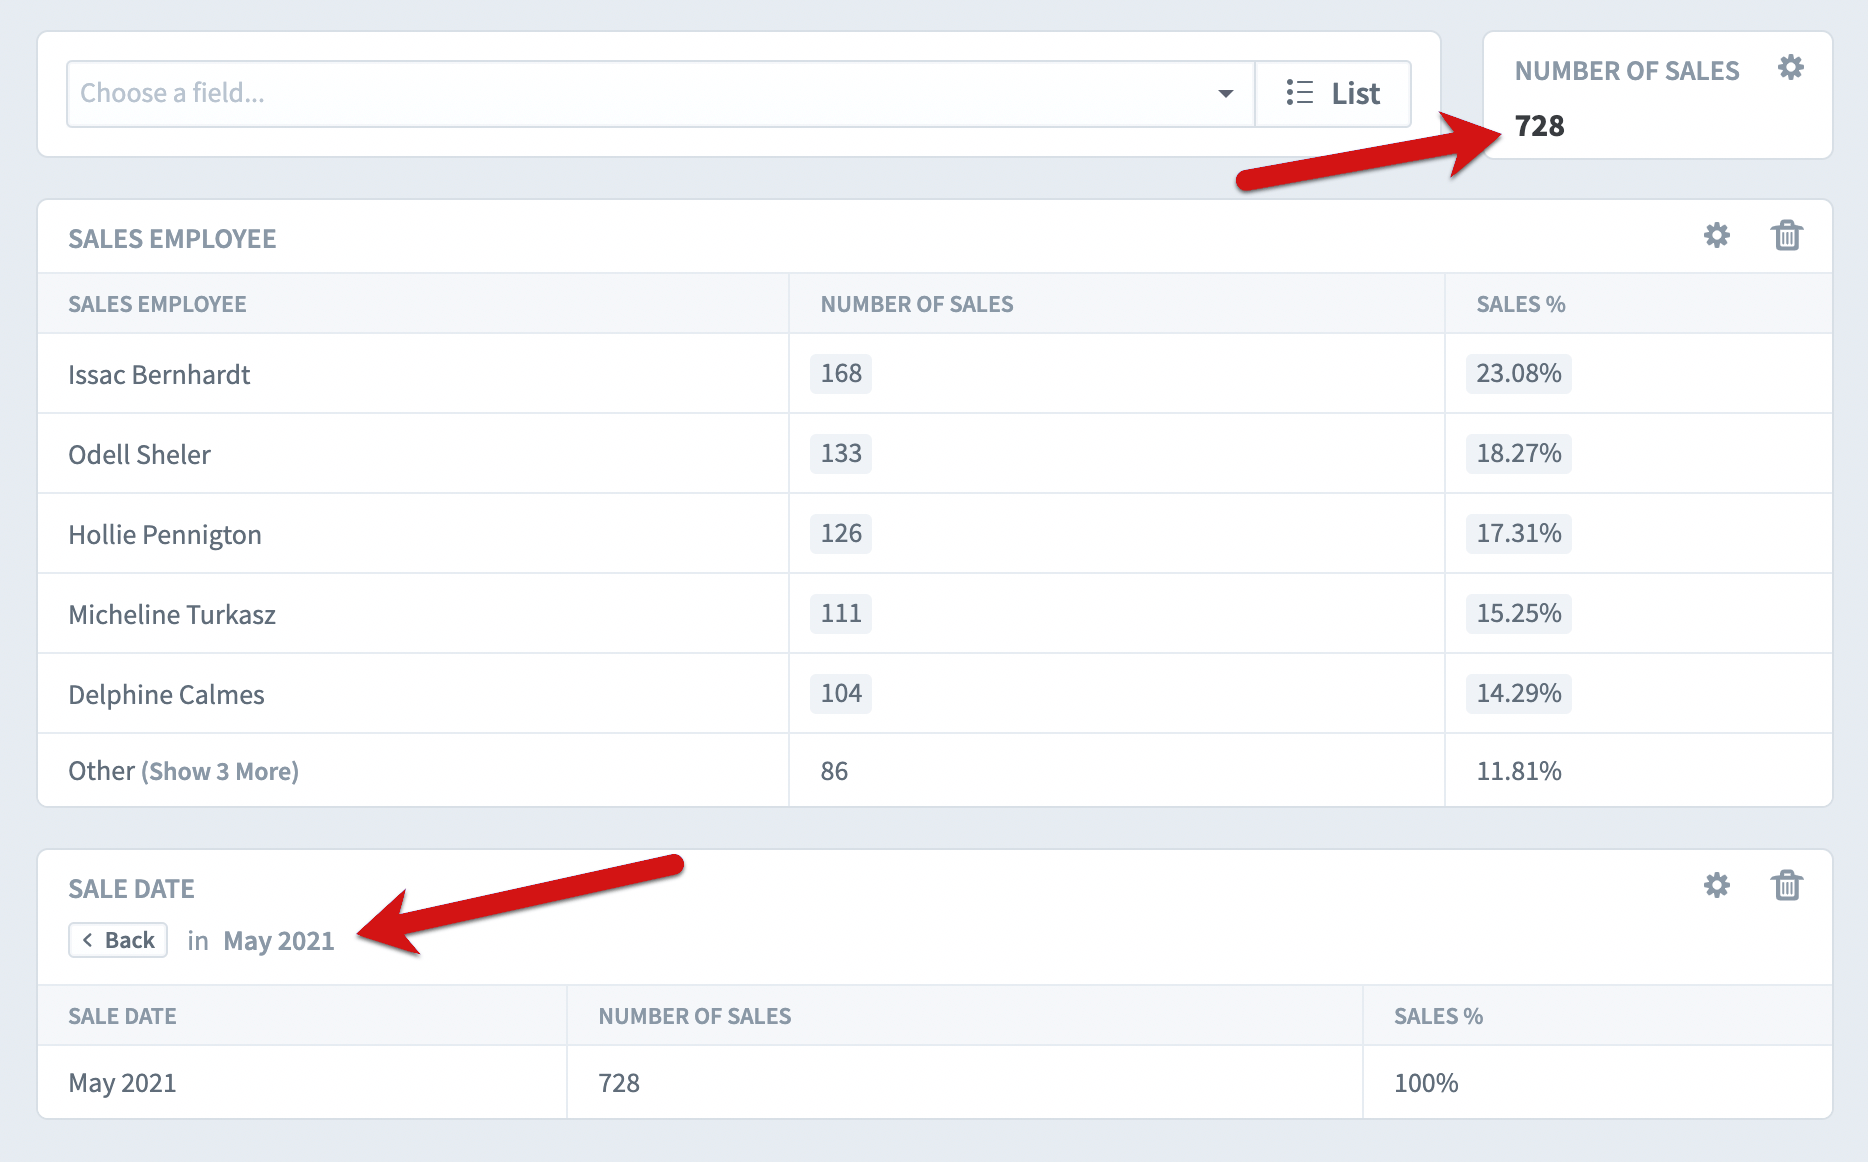
This applies a “Sale Date = May 2021” filter to all of the data on the screen. In the upper right corner, we can see that the number of sales has been updated to 728. All of the numbers in the Sales Employee table now reflect only May 2021 sales. To remove the filter, just click the back button in the Sale Date table.
Although you can do advanced data exploration on the Datasets Explore tab, this is what most of your analysis will look like. You choose fields to view, and then you click on a row to filter.
