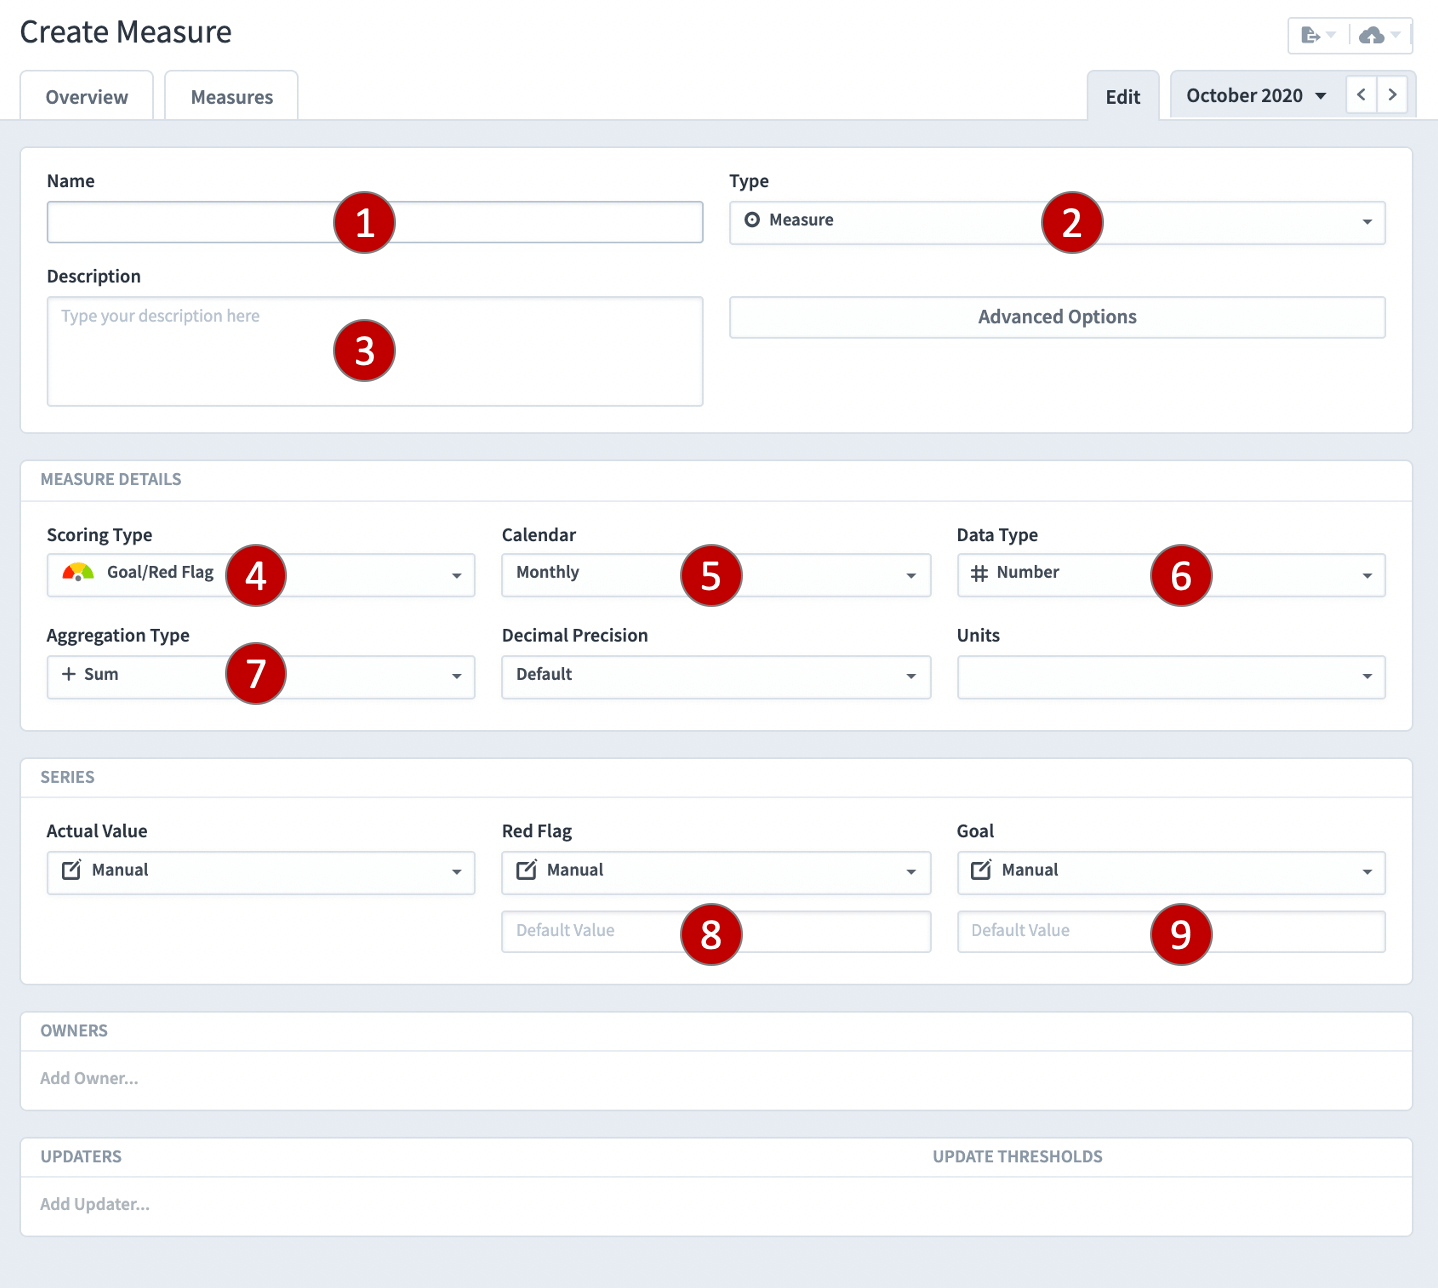
When creating Measures the following information needs to be provided:

1. Name – this should be a label 3-5 words long.
2. Type – this should be Measure.
3. Description – this is optional but it is good practice to provide a description which includes where the Measure data can be found.
4. Scoring Type – the scoring type can be one of eleven types. On most occasions, this will be Goal/Red Flag (Red/Amber/Green).
5. Calendar – this relates to the frequency the data is collected, normally monthly for general management reporting.
6. Data Type – the application can handle Currency, Percentage, Numeric and Yes/No data.
7. Aggregation Type – this tells the application what to do with actual values when looking at them using a calendar other than the frequency collected calendar previously selected.
For example, for a Currency, the aggregation type is normally Sum. When looking at monthly data with a yearly calendar, you want the application to sum the months.
For a Percentage, the aggregation type is normally Average. When looking at monthly data using a yearly calendar, you want the application to take an average over the months.
Thresholds: You need to tell the application when you expect a Measure to turn red (from amber) and green (from amber)
8. Red Flag – For example, if the Measure is deemed to be Red below $25,000, the Red Flag value is $25,000.
9. Goal – this is the Green Flag threshold, this is usually the target.
10. Owner – Optionally add the Owner (this can be done later). The person who owns this object.
11. Updater – Optionally add the Updater (this can be done later). The person who updates the Measure with actual values.
Very Important:
- When you have entered all of the data click the blue Create button
