Creating a dataset
To create a new dataset, click on the “New Dataset” button at the top of the navigation pane.

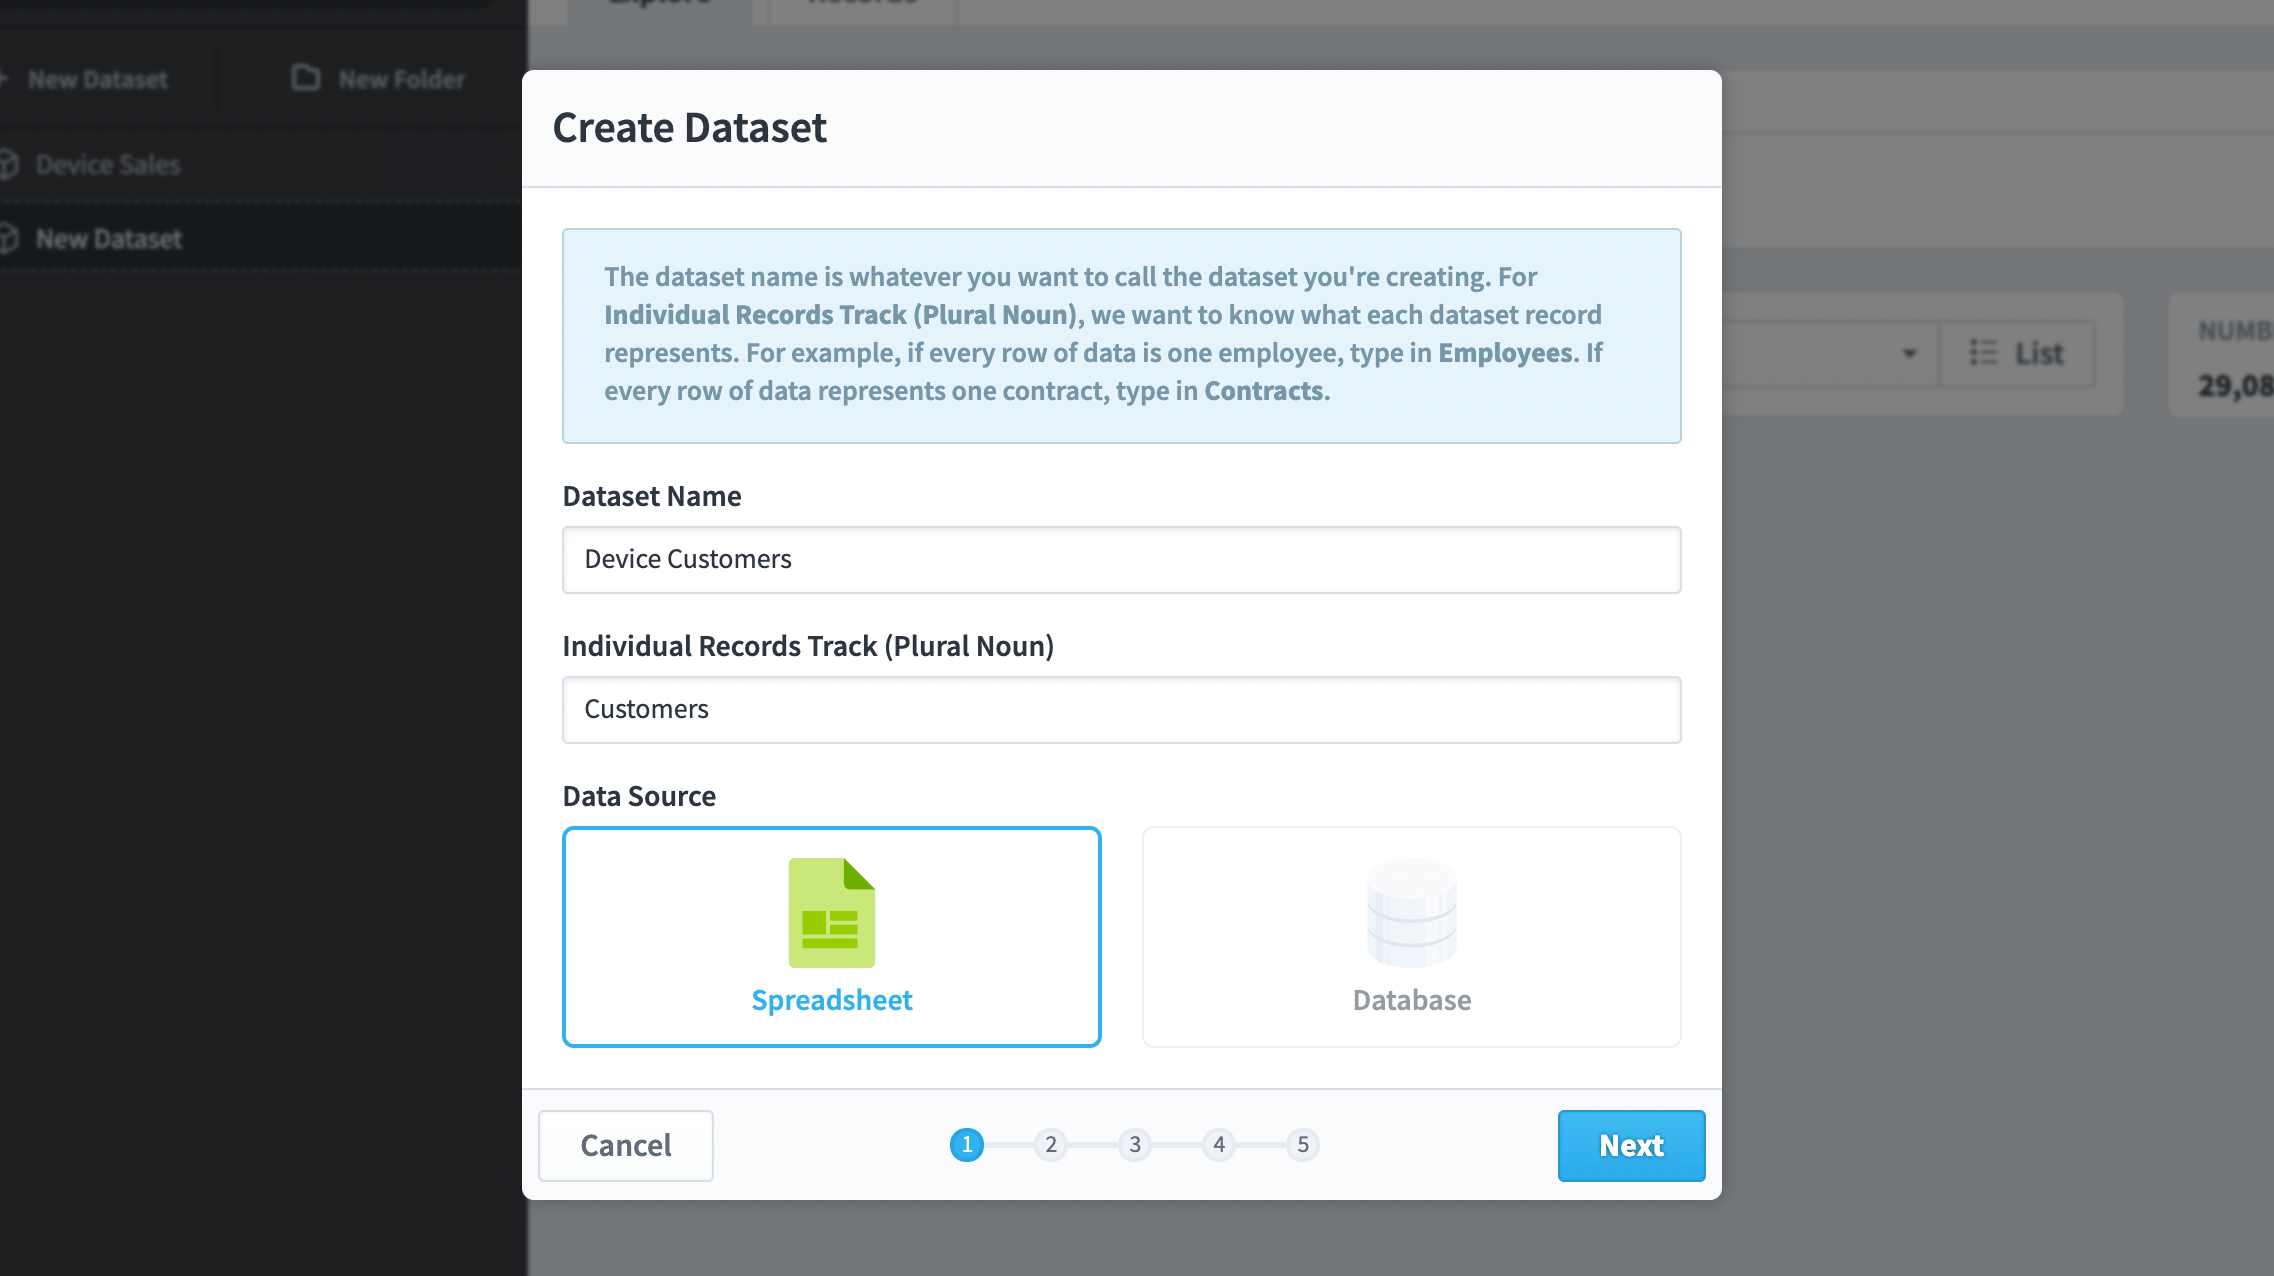
This brings up the new dataset dialog. The “Dataset Name” is what you want to call your dataset, and it shows up in the navigation pane on the left. The answer to “Individual Records Track” should be the plural form of one row of your data. In this example, we’re tracking device customers, so we’re entering “Customers”. Finally, we can either get data from a database or spreadsheet, and we’re choosing spreadsheet.
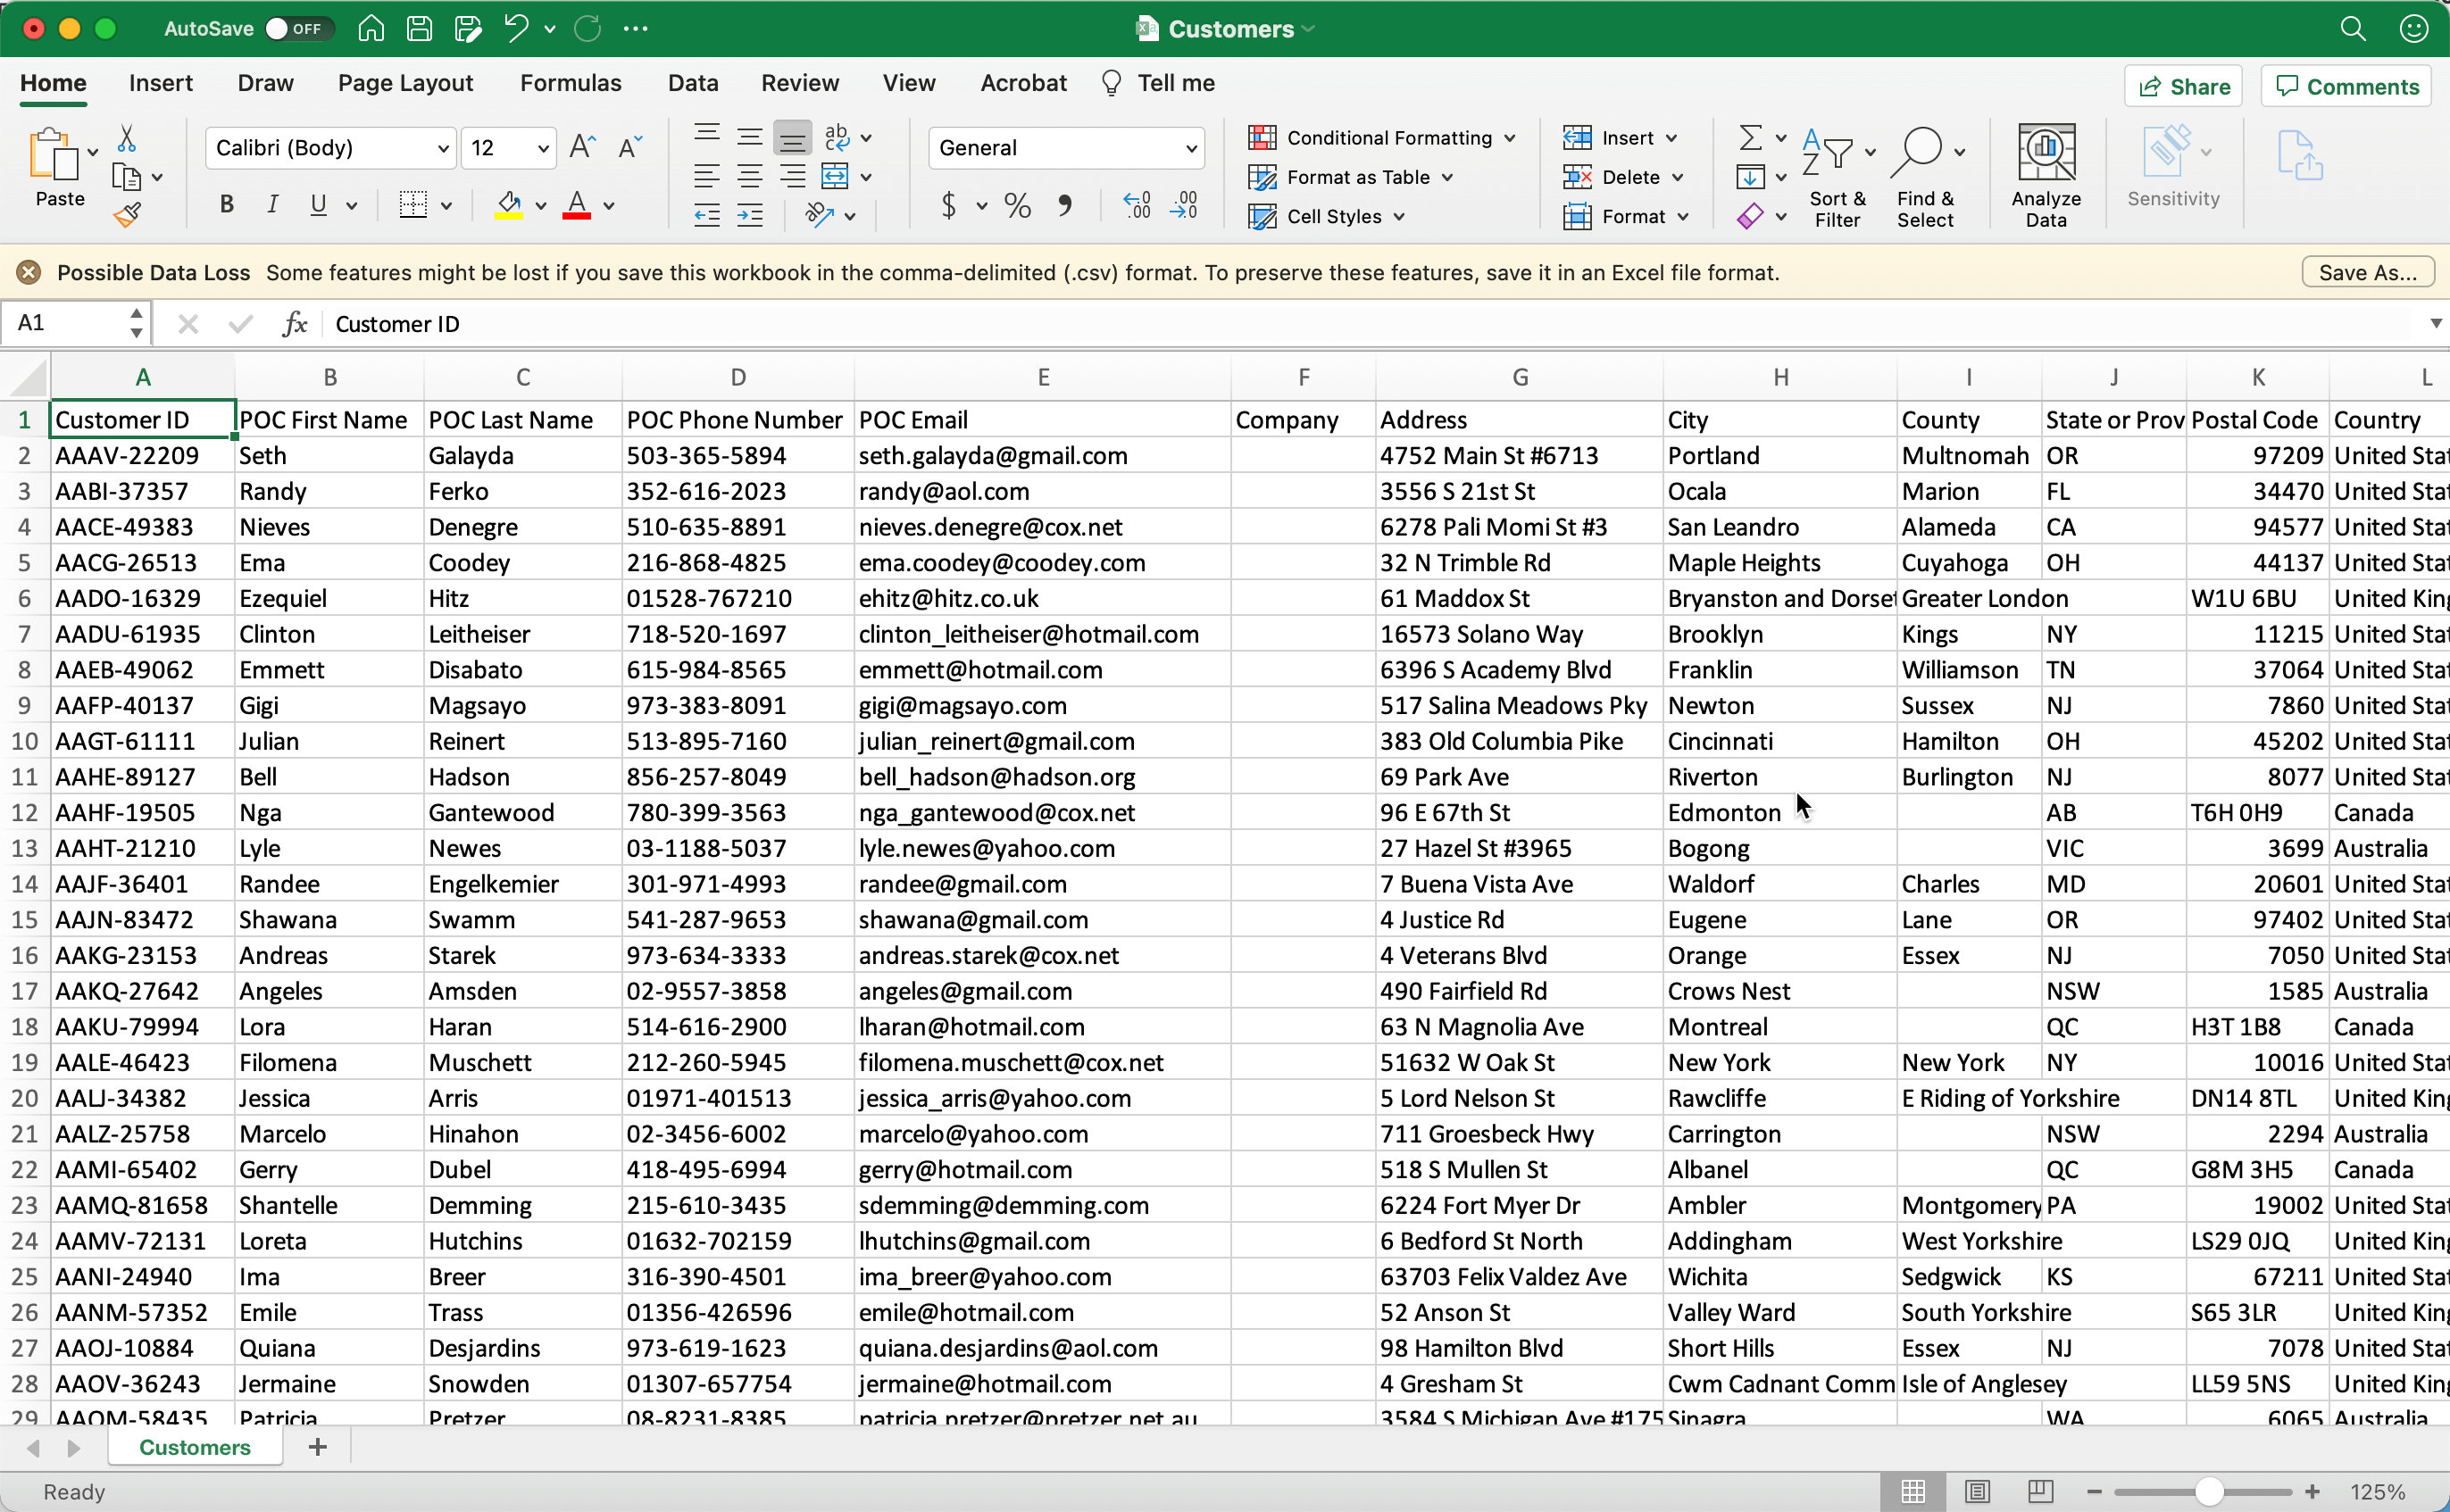
You can build a dataset from either a spreadsheet or a database. In this example we have a spreadsheet containing information about each of our customers that looks like this. Notice how each customer has a Customer ID in the first column.
There are multiple options for where to get spreadsheets. To fully automate your data flow, you can schedule an import from Google Sheets or an (S)FTP server. If you want to build multiple datasets from the different worksheets in an Excel file, you’ll probably want to store a single file in the Files section and build your datasets from that. See the Updating Datasets article for more information.
For now, we’ll just keep it simple and upload a file.
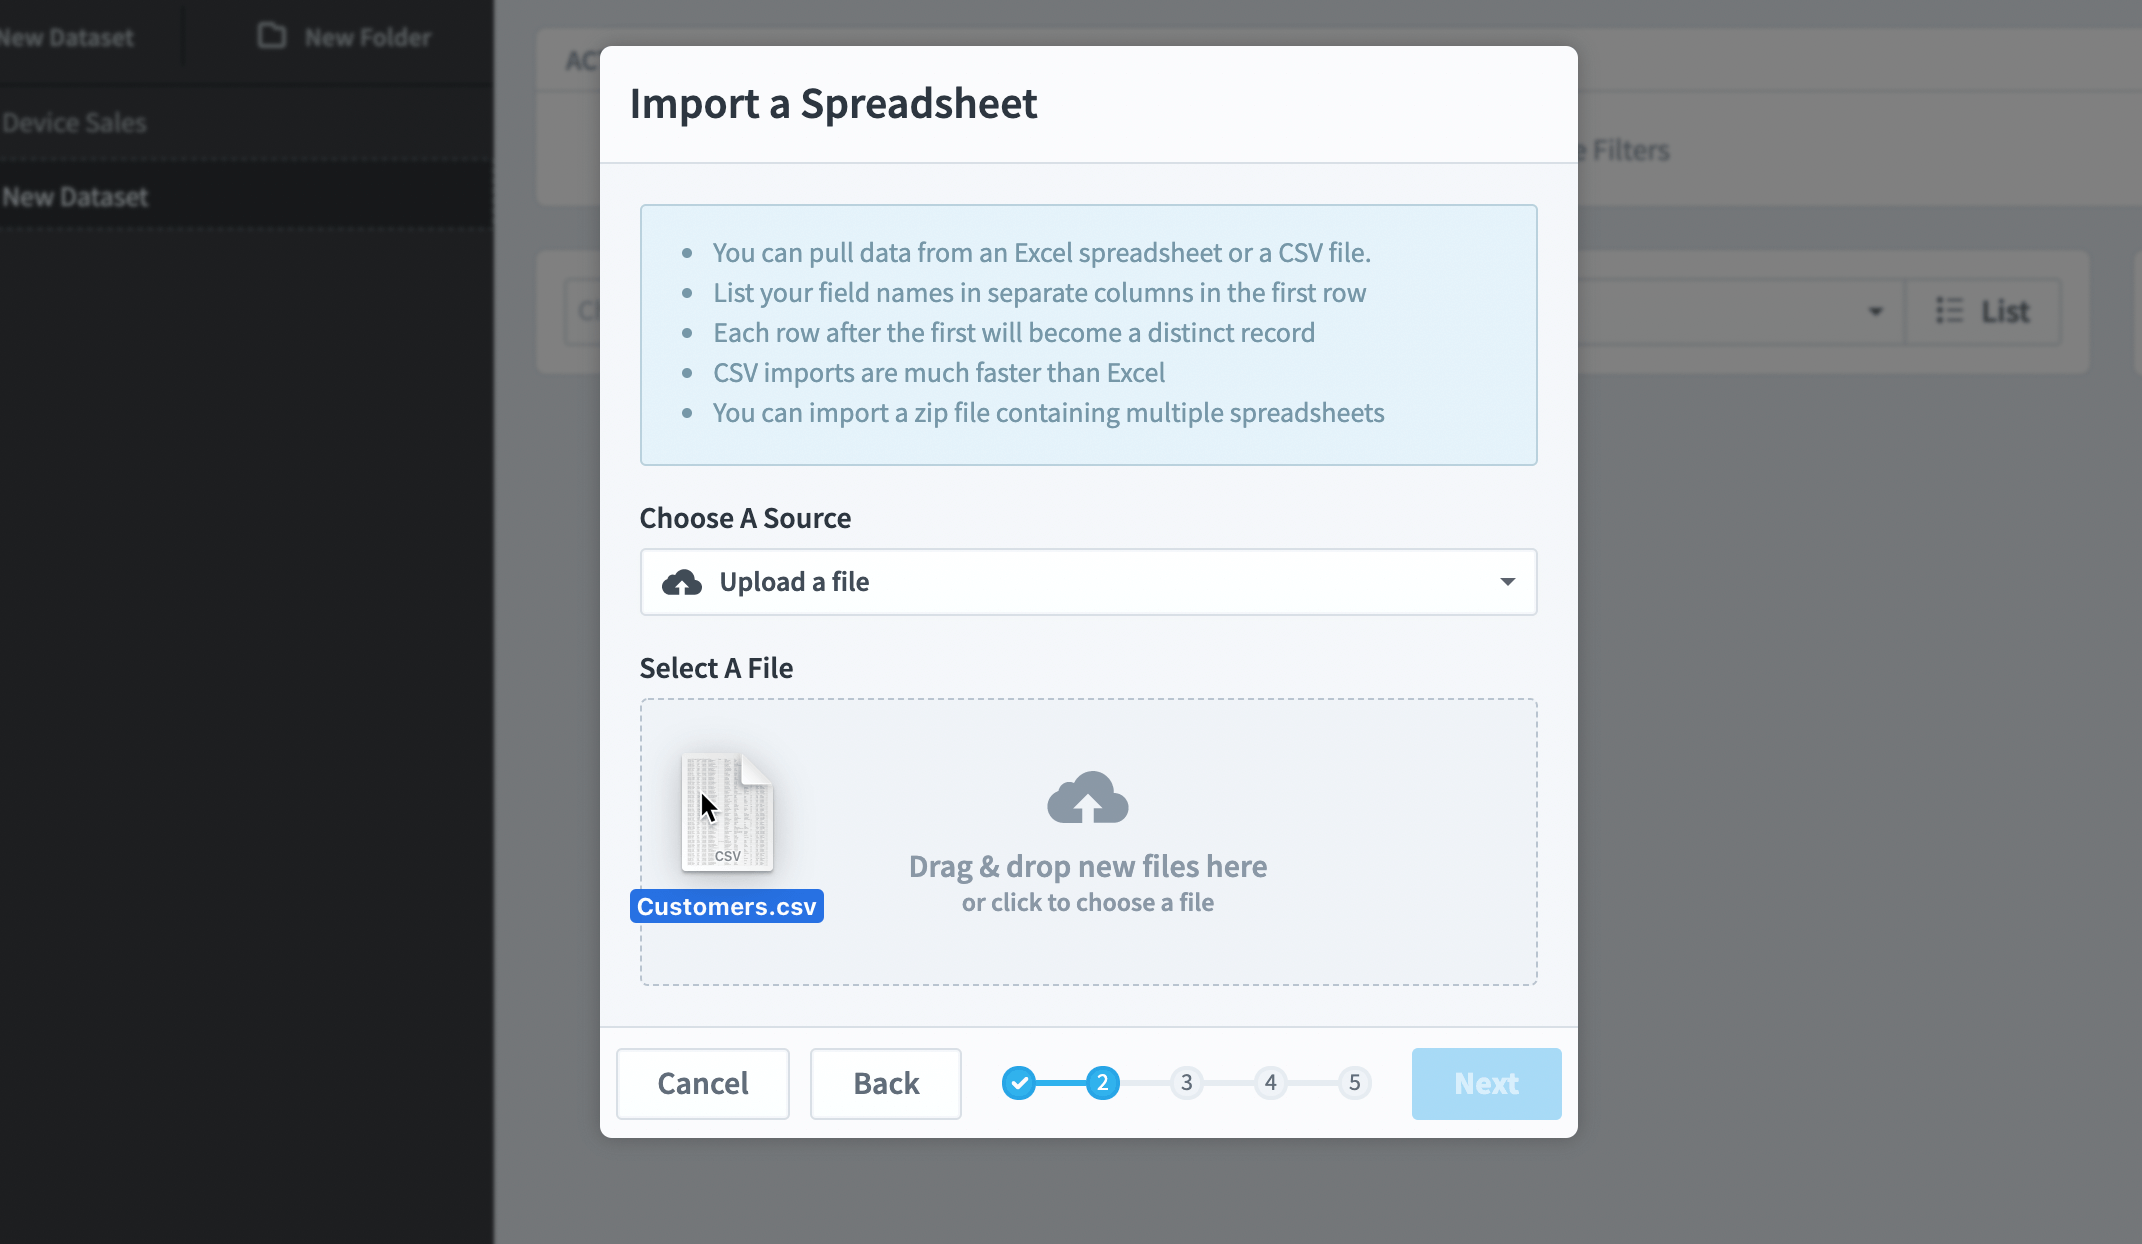
Once the spreadsheet is uploaded, Spider Impact starts to scan and process it. This may take anywhere between a few seconds and many minutes, depending on the size of your data.
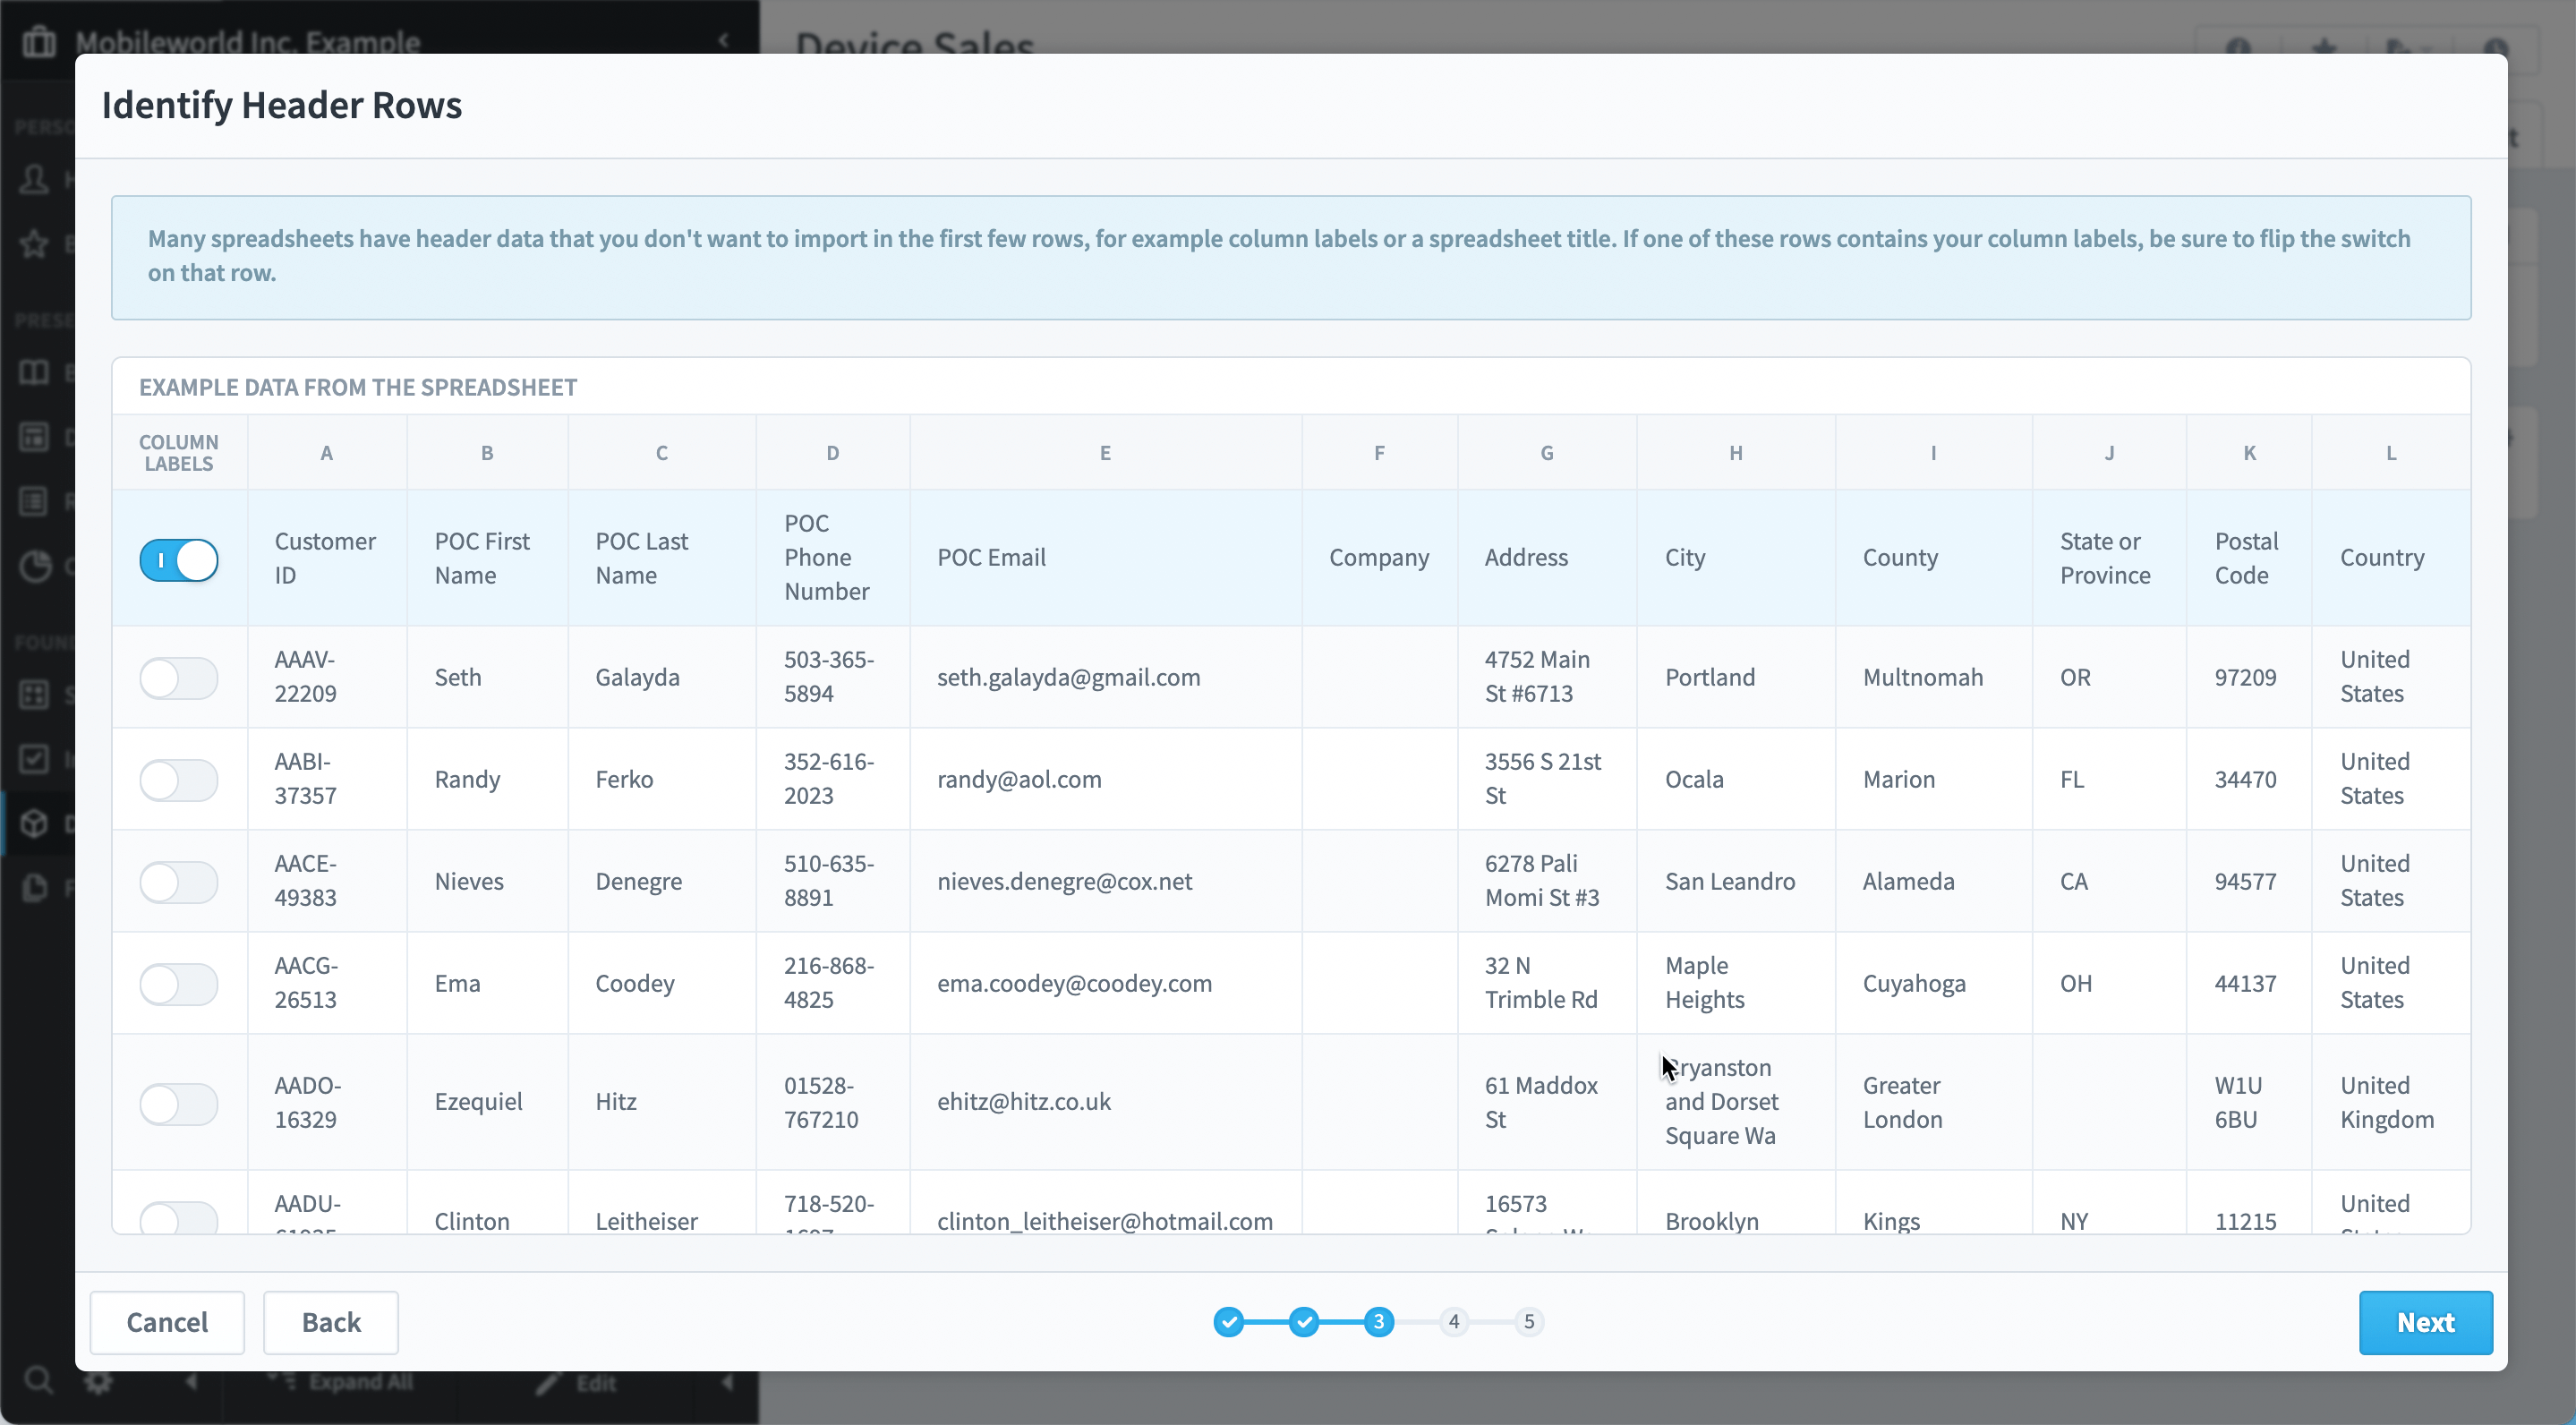
When it’s done processing, the next step is to choose the header row that contains the column labels. If you’re using an Excel file with multiple worksheets, you’ll choose which worksheet you want to use on this step too.
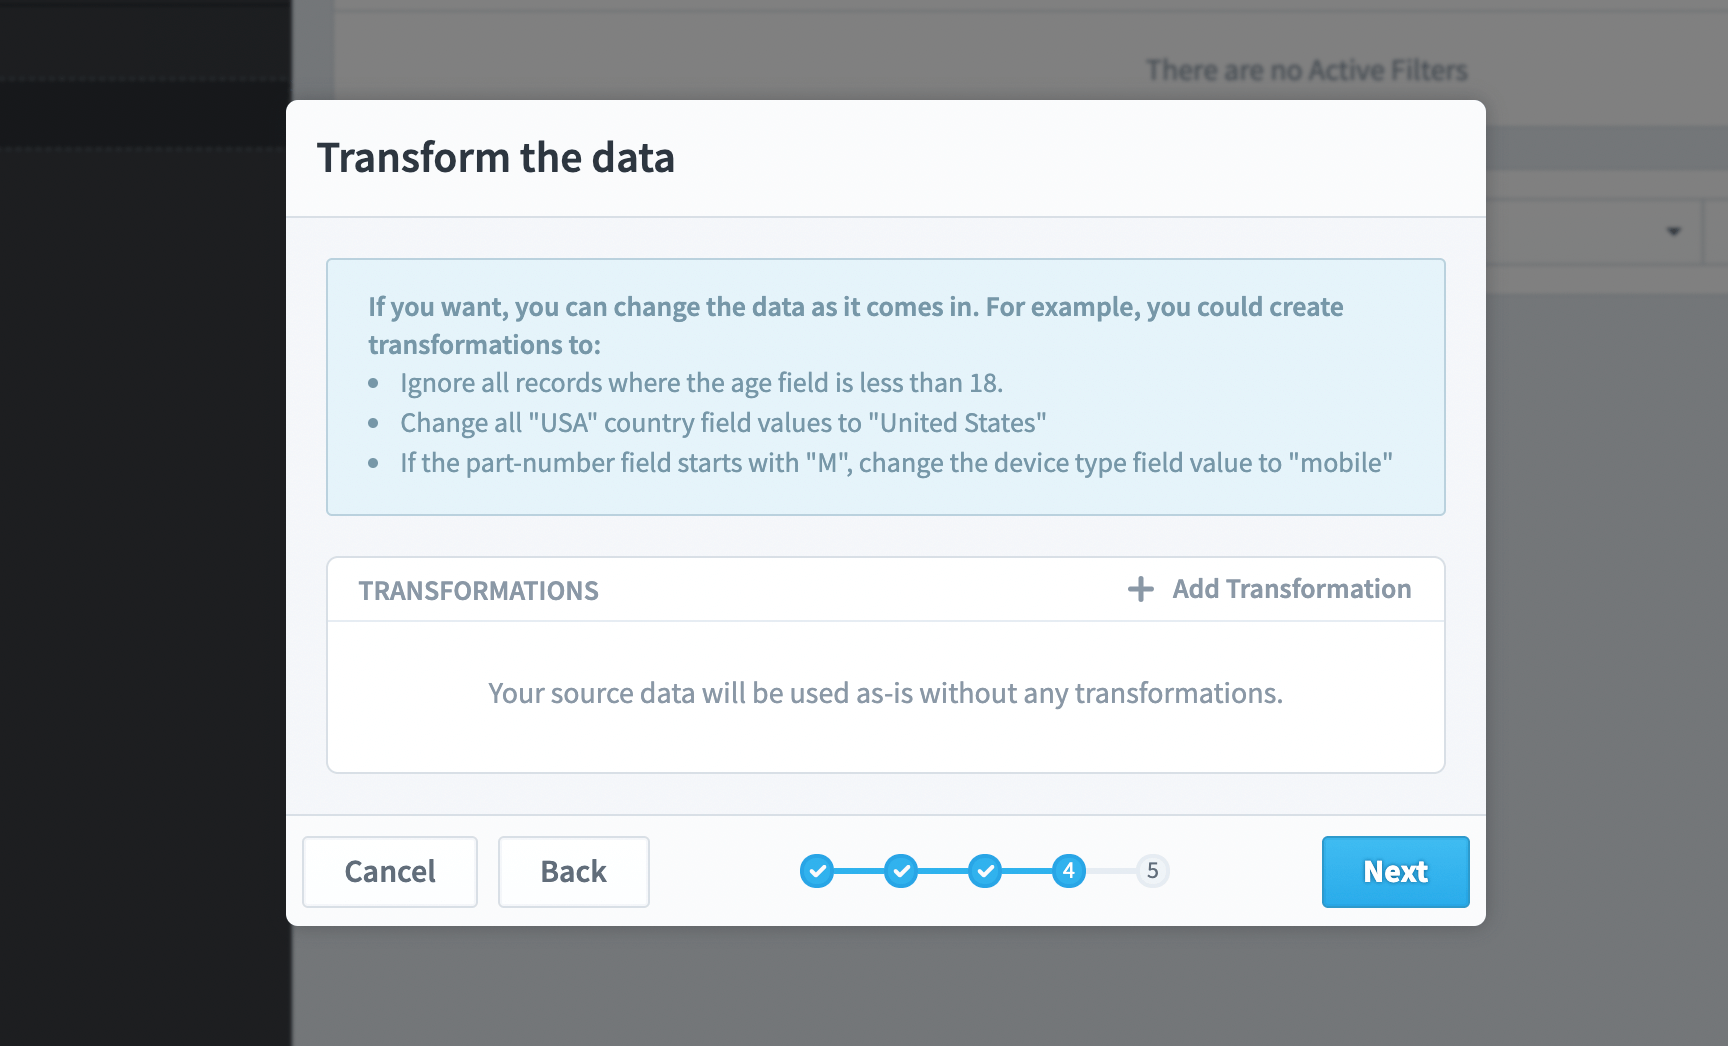
The data transformation step is next, and it allows you to apply powerful transformations to your data as it’s imported. You can skip records, combine fields together, or clean dirty data.
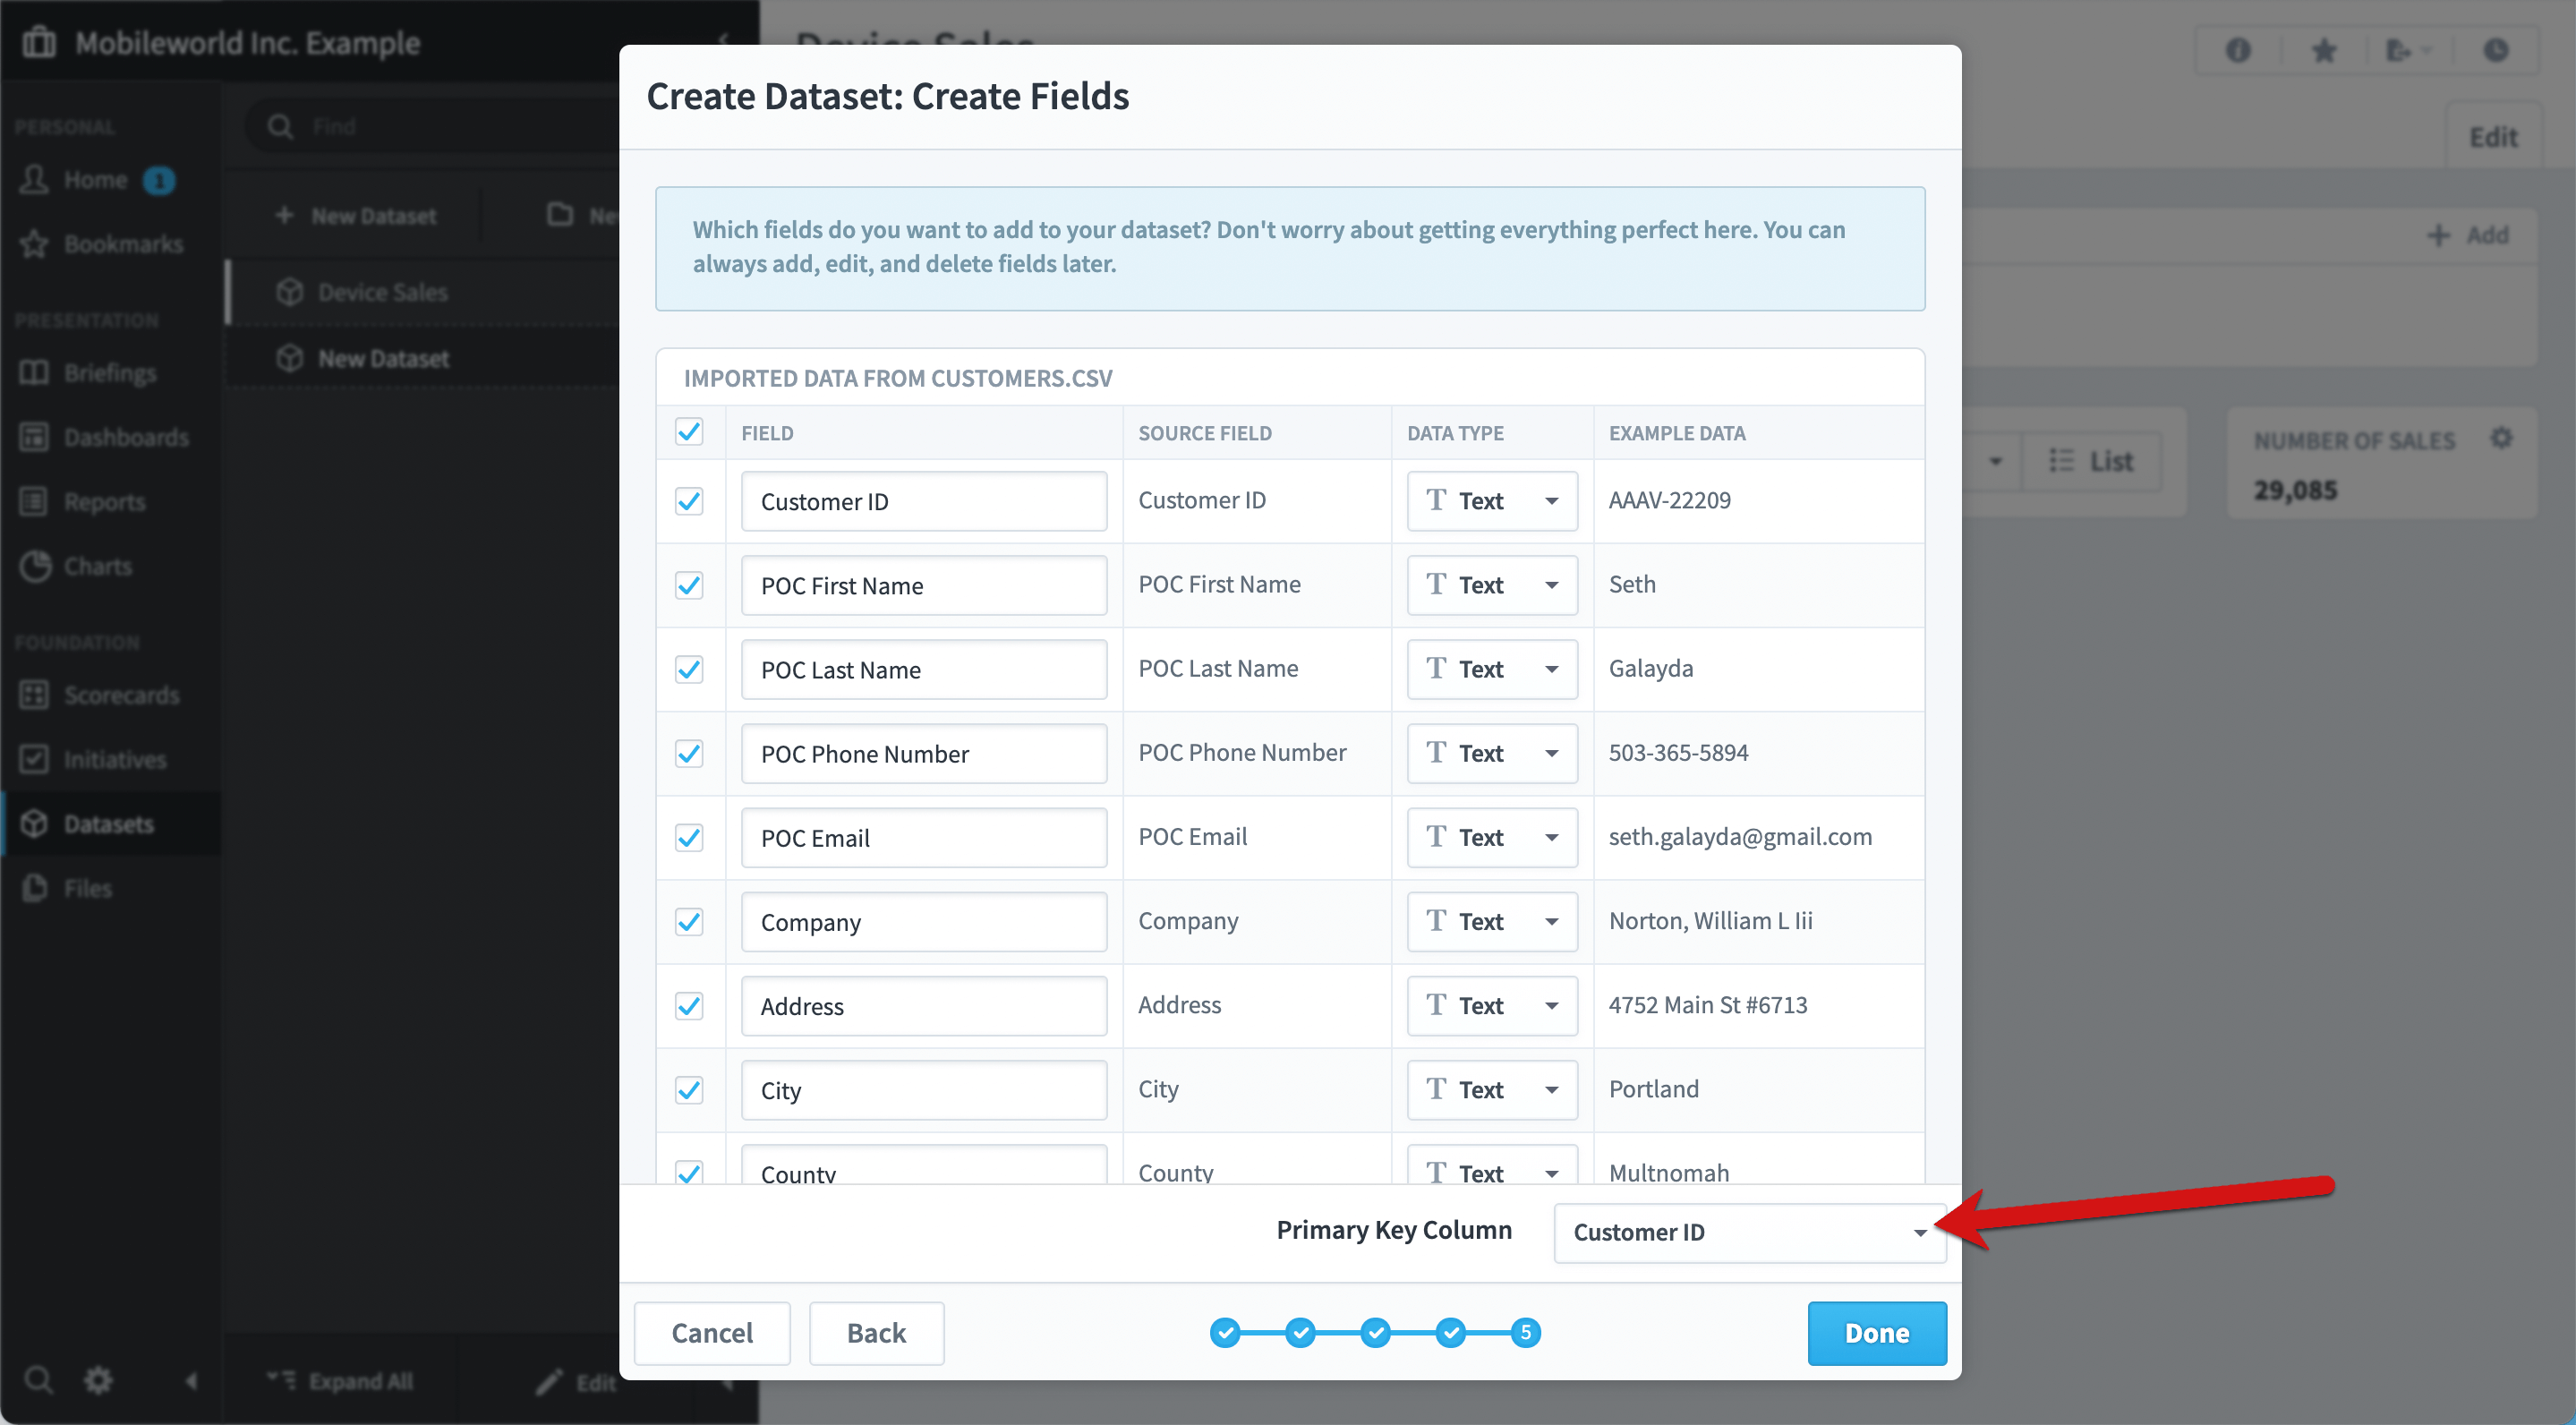
Finally, you choose which fields you want to include in your dataset. This is your first opportunity to choose a better name or data type for each field, but you can always edit fields on the Edit tab later.
In this example we’re also setting Customer ID as the primary key, which allows us to update records later as well as link datasets together.
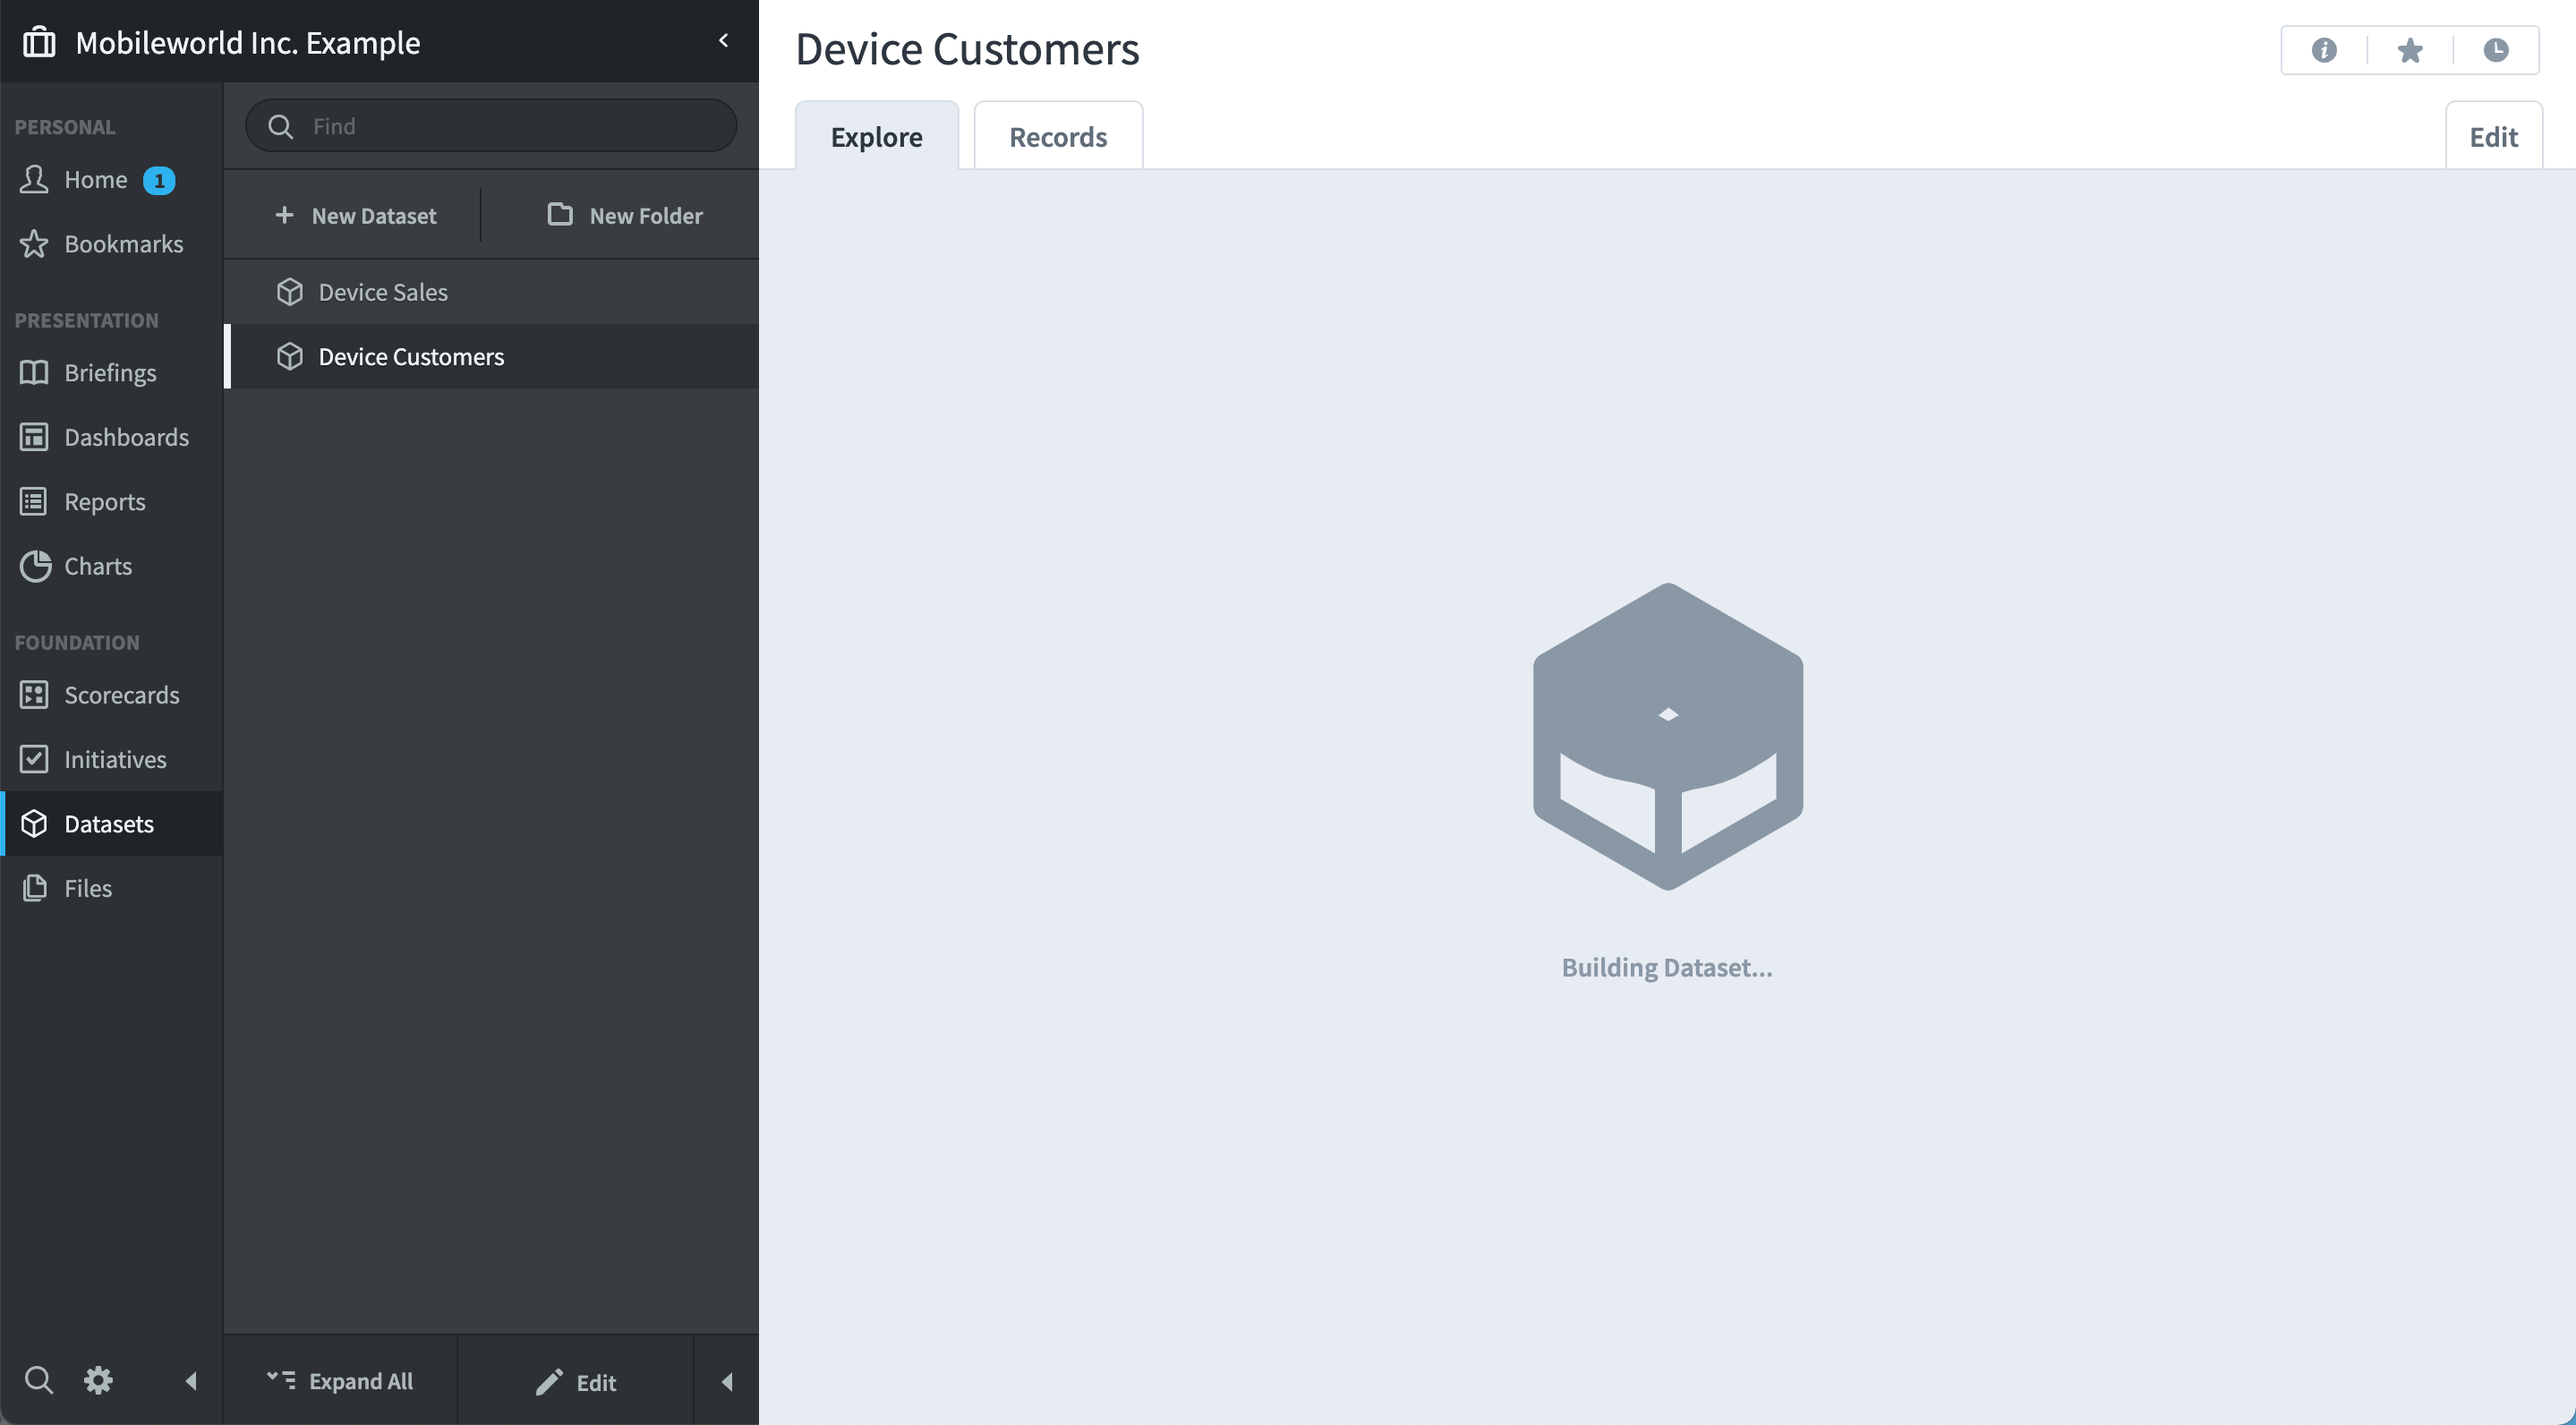
After you click Done it can take several minutes or longer for your dataset to build, depending on the amount of data.
Editing datasets
To edit a dataset, just go to its Edit tab. Here you can modify several things that you set up when initially building the dataset.
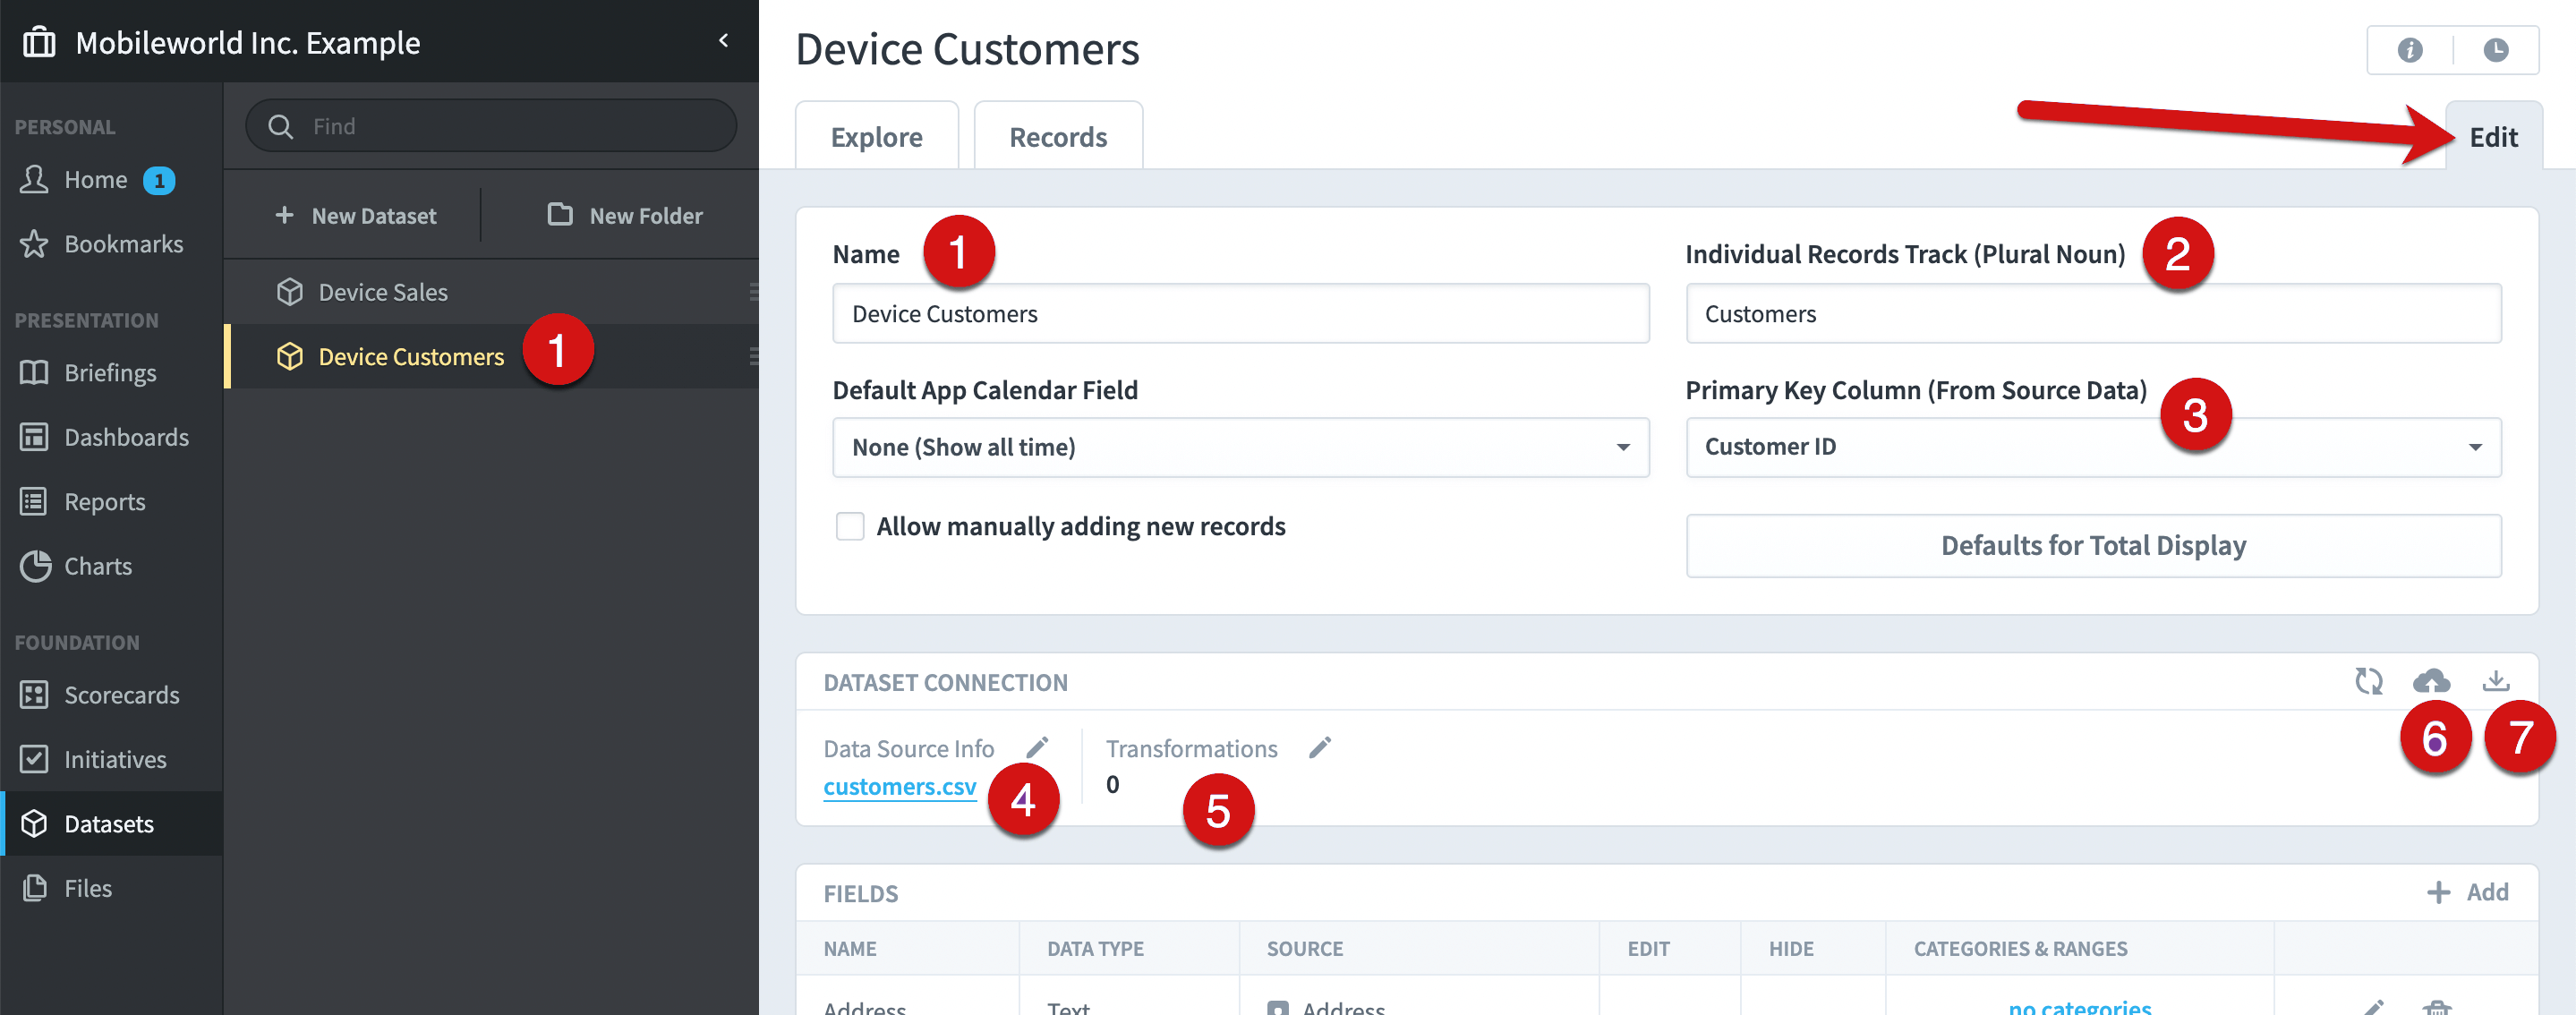
- The dataset name that shows in the navigation pane.
- Used throughout the app to identify what is stored in the dataset, for example the total box.
- The primary key field.
- The data source.
- Optional data transformations.
- Upload a new spreadsheet. For connections to Databases, Google Sheets, and (S)FTP this will be a “Fetch Data” button to pull in the latest data.
- Download the most recently imported spreadsheet.
Editing fields
You can edit dataset fields on the Edit tab by clicking on their edit buttons.
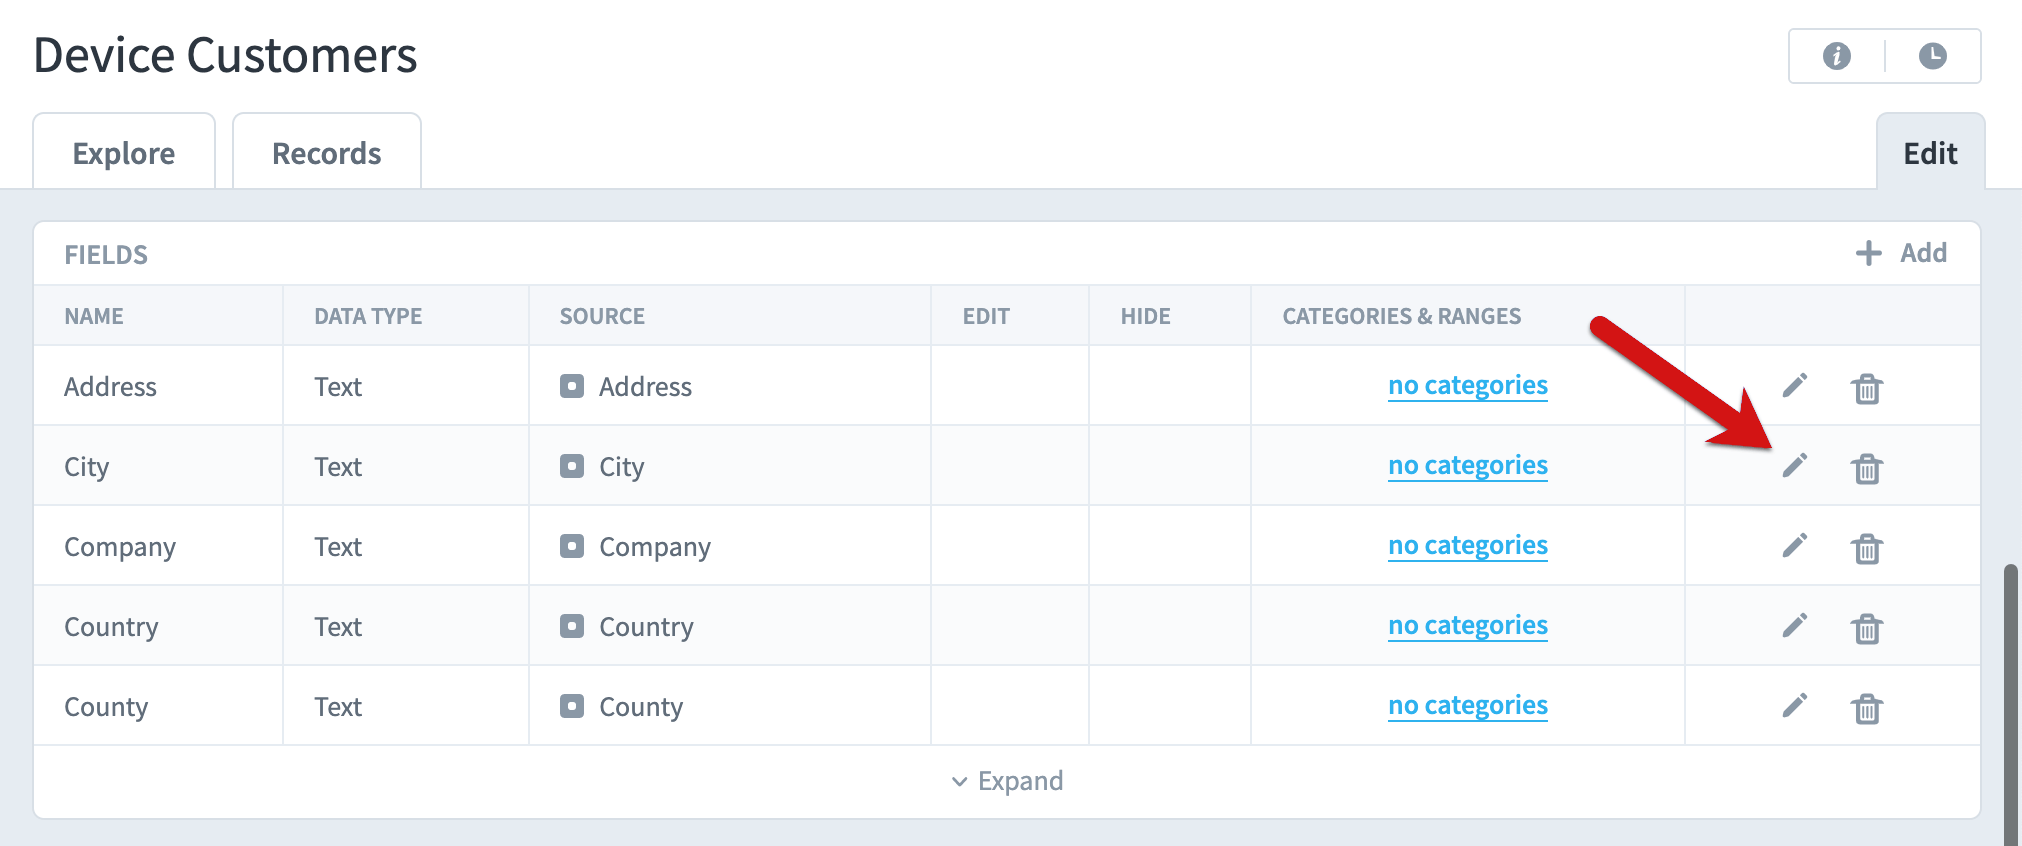
This opens the Edit Field dialog.
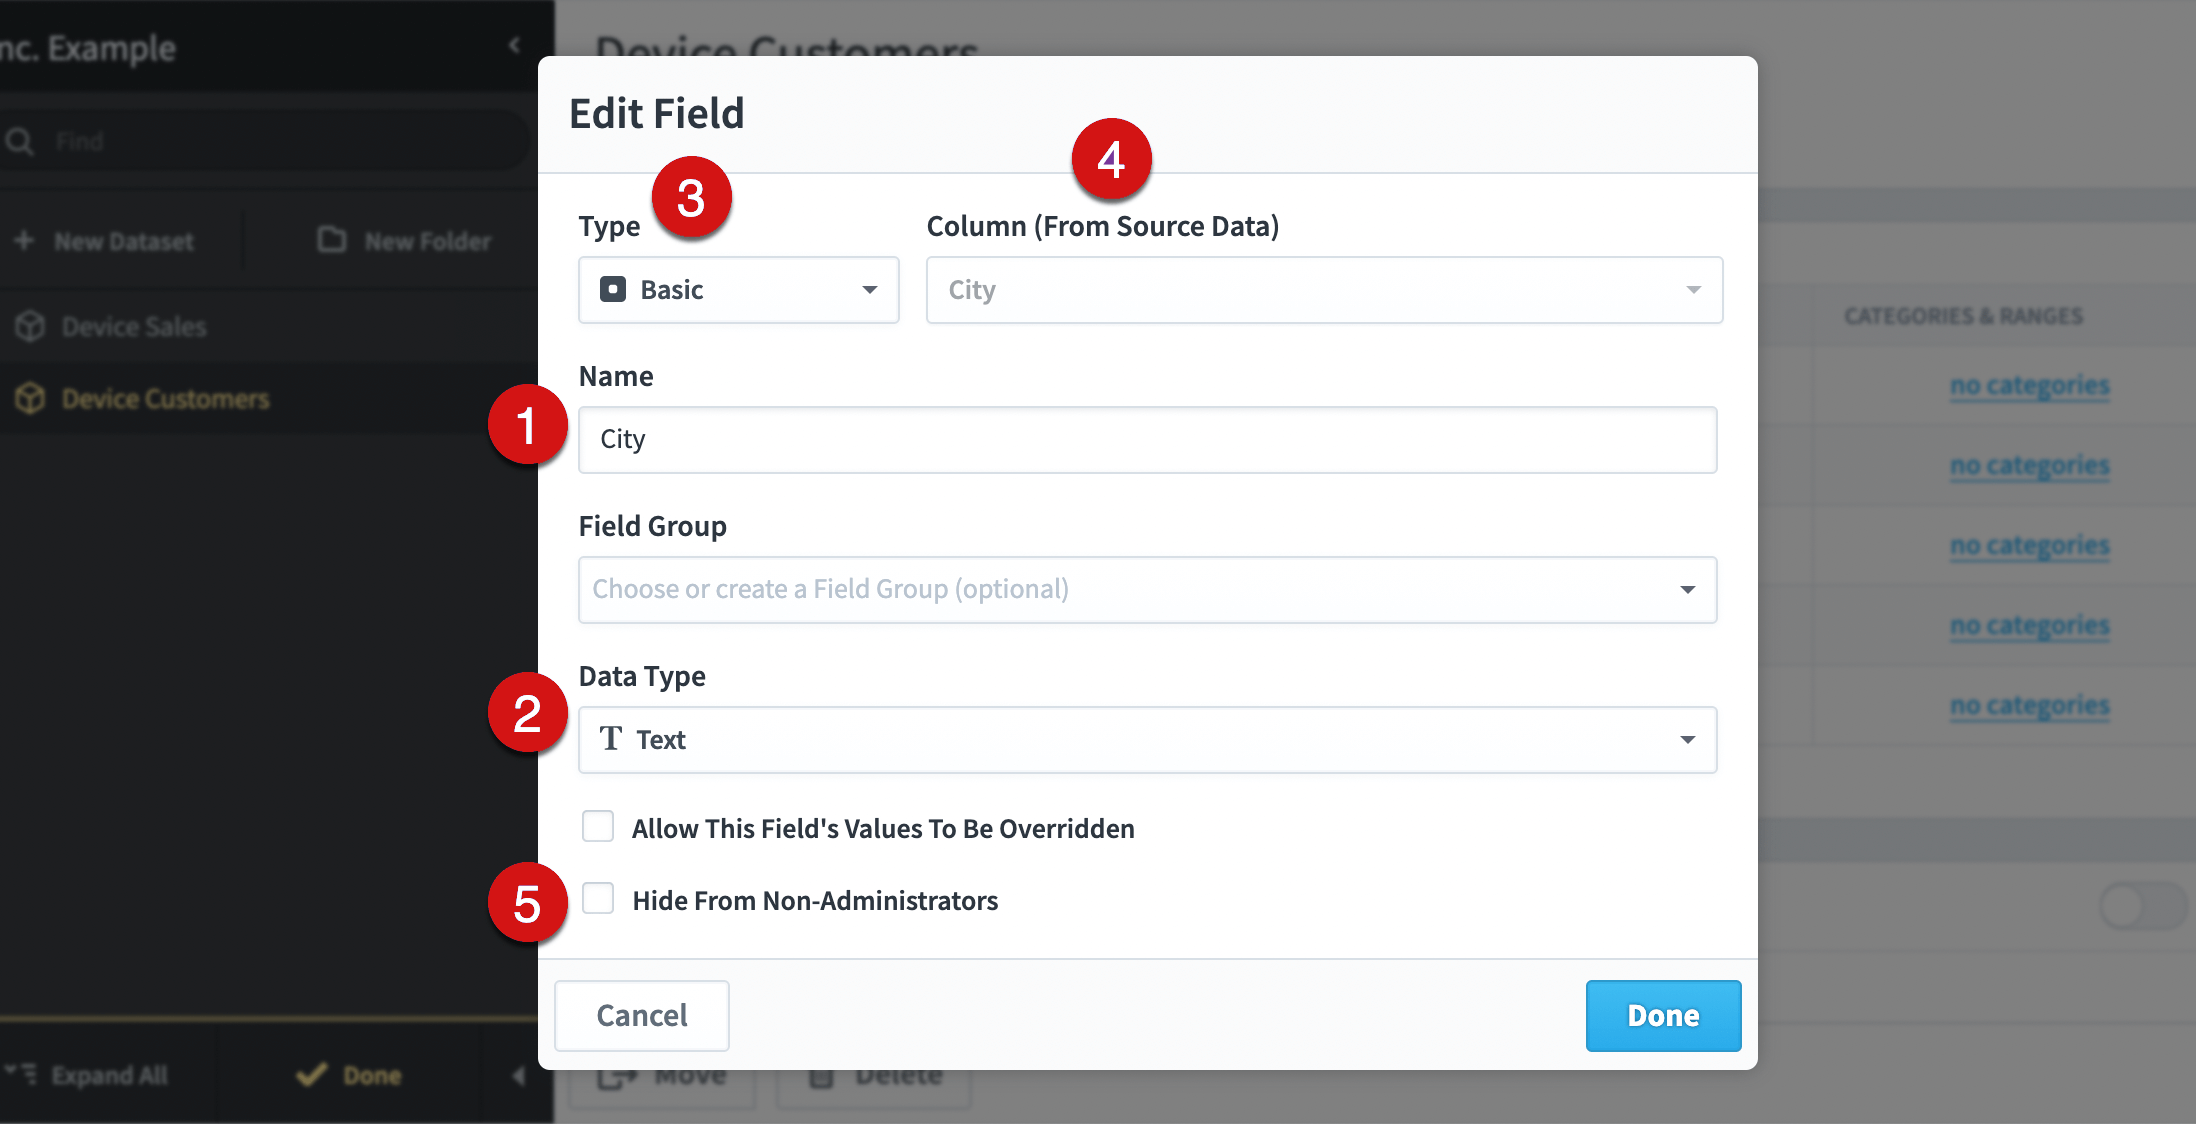
- The field name
- The field’s data type, for example Text, Date, Number, Etc.
- A Basic field is simple, it’s just one column of data. You can also create fields that are Calculated or Data Clusters, which are covered below.
- The column to use for the basic field.
- Hide From Non-Administrators allows you to prevent a field from showing in Spider Impact. For example, if you’re you’re using a private ID number to link multiple datasets together, you could use that field for linking on the Edit tab, but choose to hide that field everywhere else.
Dataset rebuilding
There’s a “Rebuild Dataset” button that rebuilds a dataset with the same data it had before. If you run into an unexpected problem, sometimes manually forcing a rebuild can fix it.
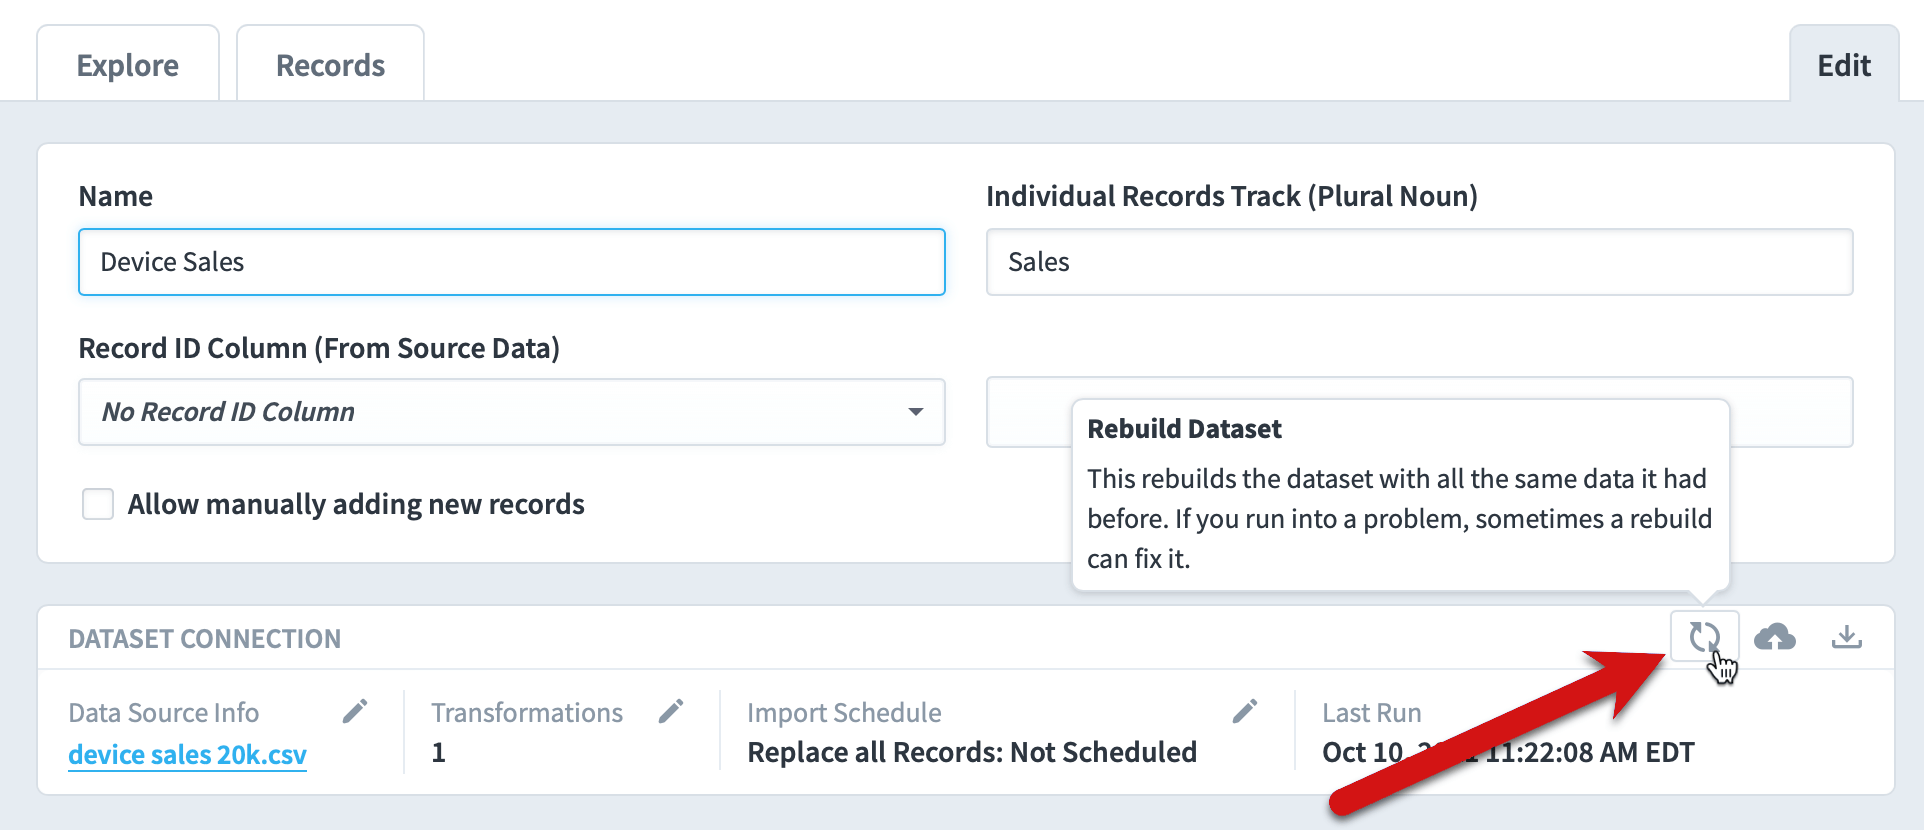
Datasets also rebuild automatically whenever you add or edit one of its fields, or when you edit a field used by one of its calculated fields. This rebuild is the same as the initial build described above, except that the dataset is completely usable while it’s being rebuilt. Users will continue to see the old data until the new data is ready.
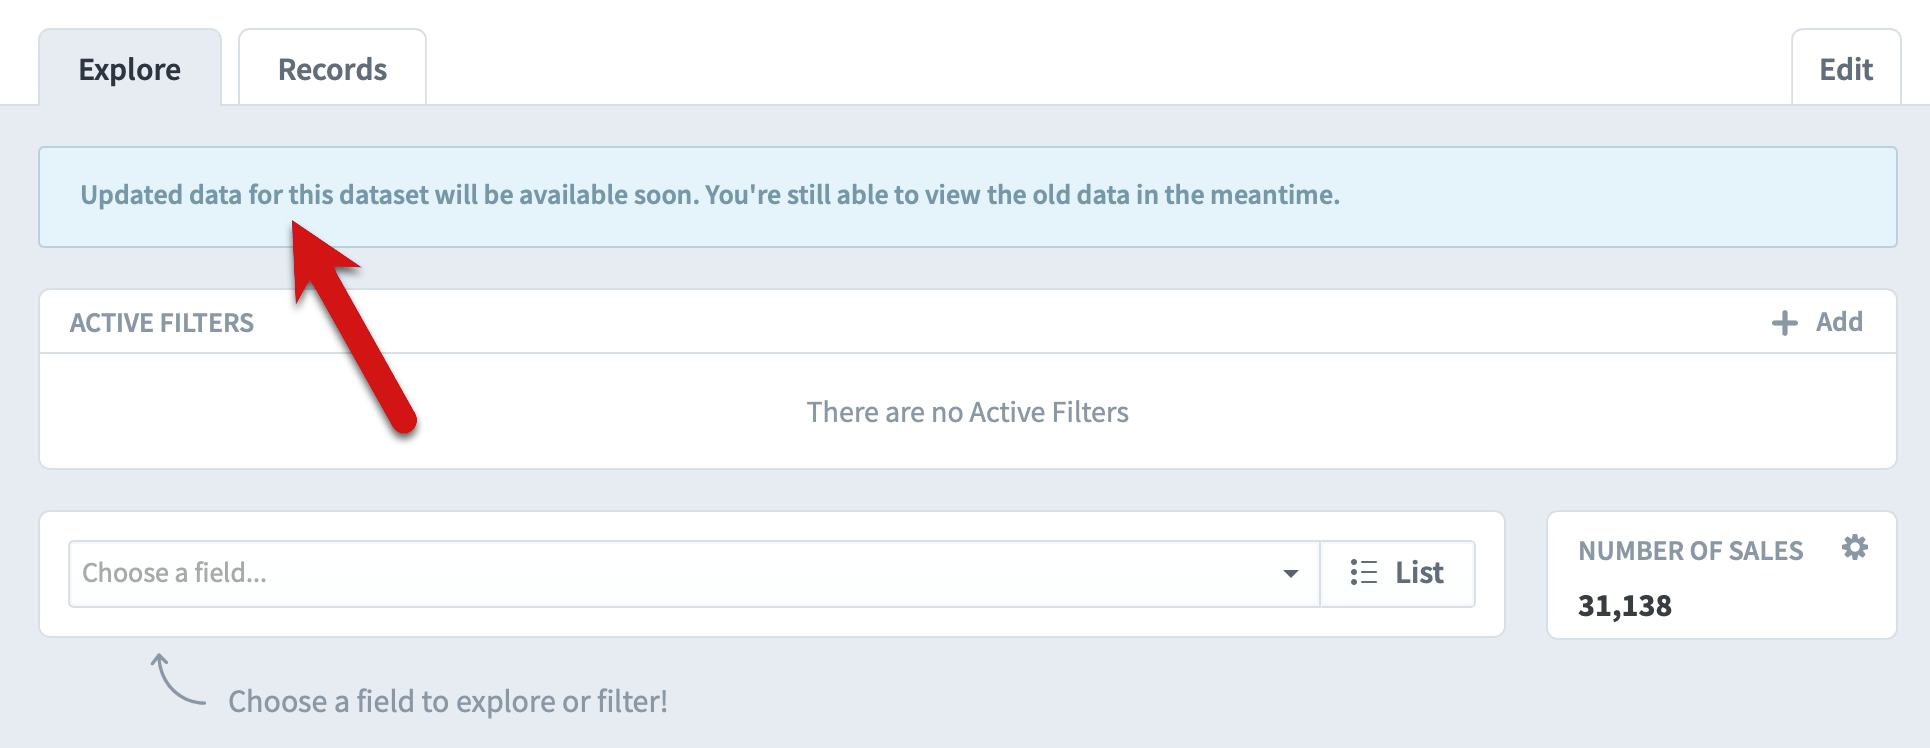
Other situations that cause a dataset to rebuild are updating dataset records and editing rollup trees. Renaming fields or changing a dataset’s permissions do not trigger rebuilds.
Field groups
Field Groups allow you to organize your fields into groups. Here we’re creating a “Point of Contact” field group and adding several fields to it.
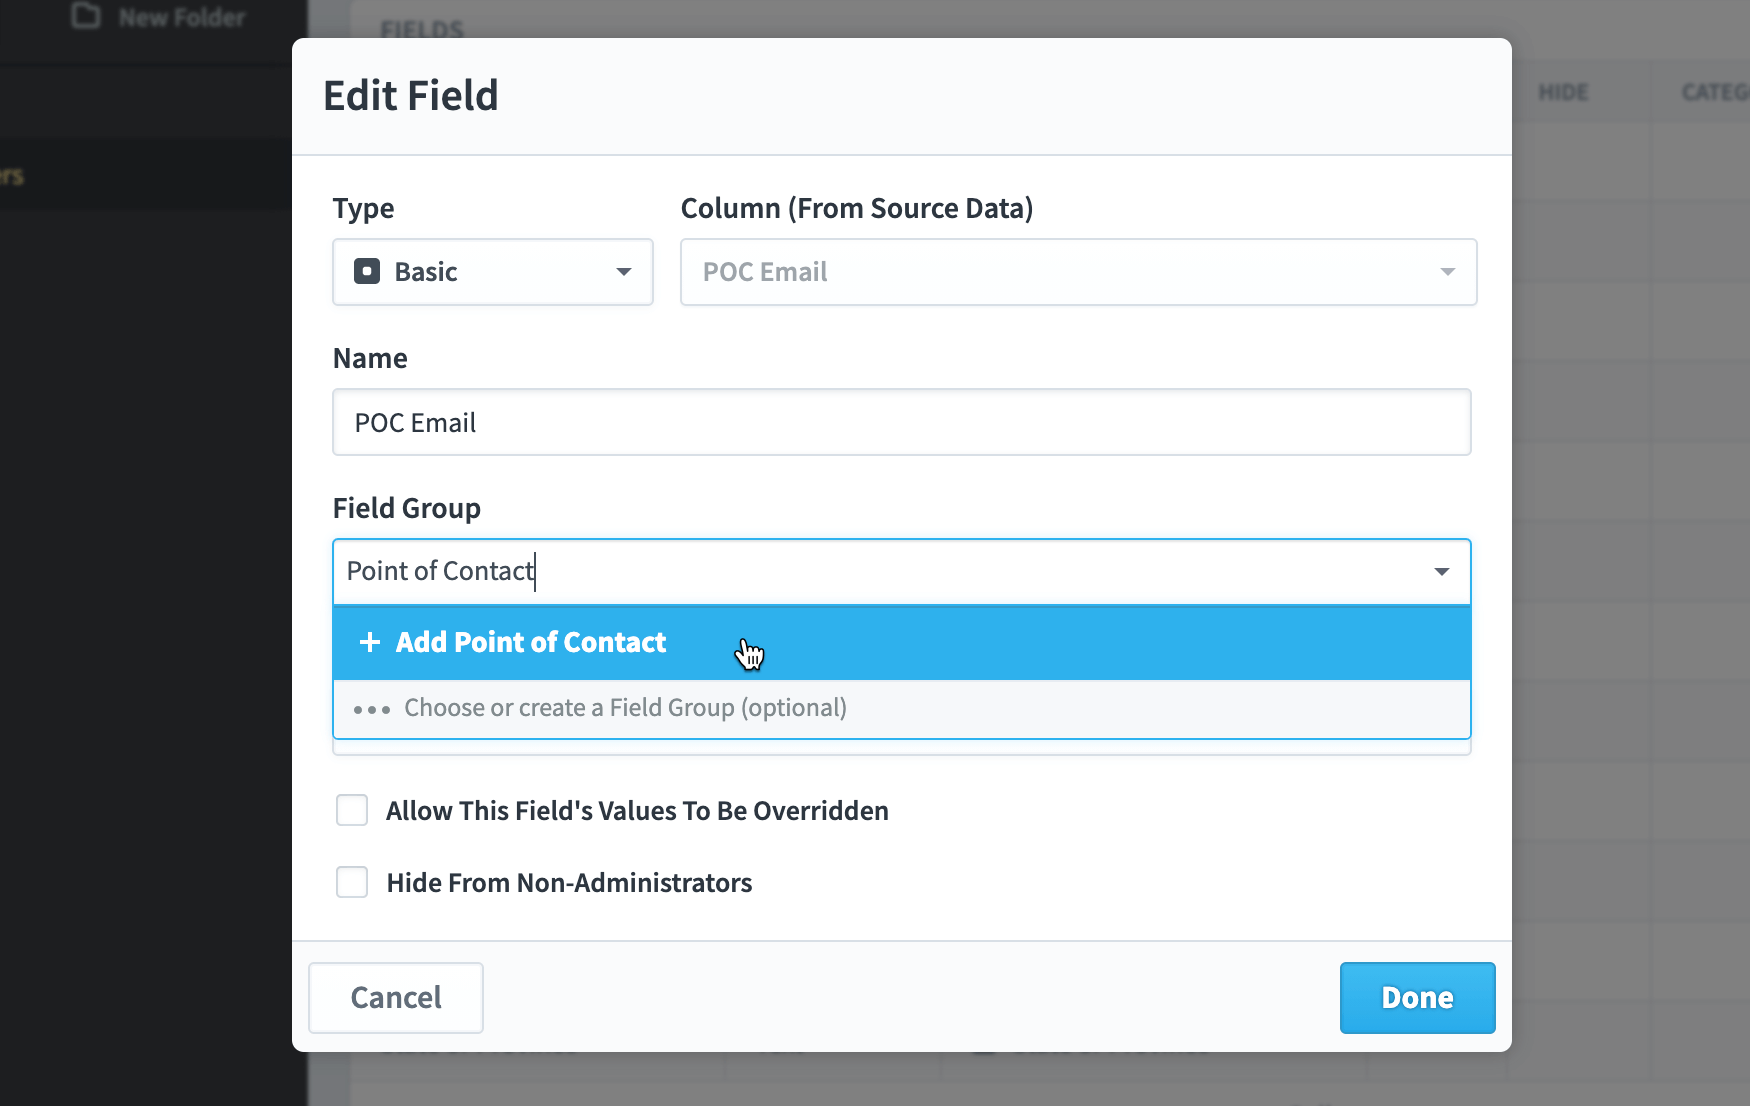
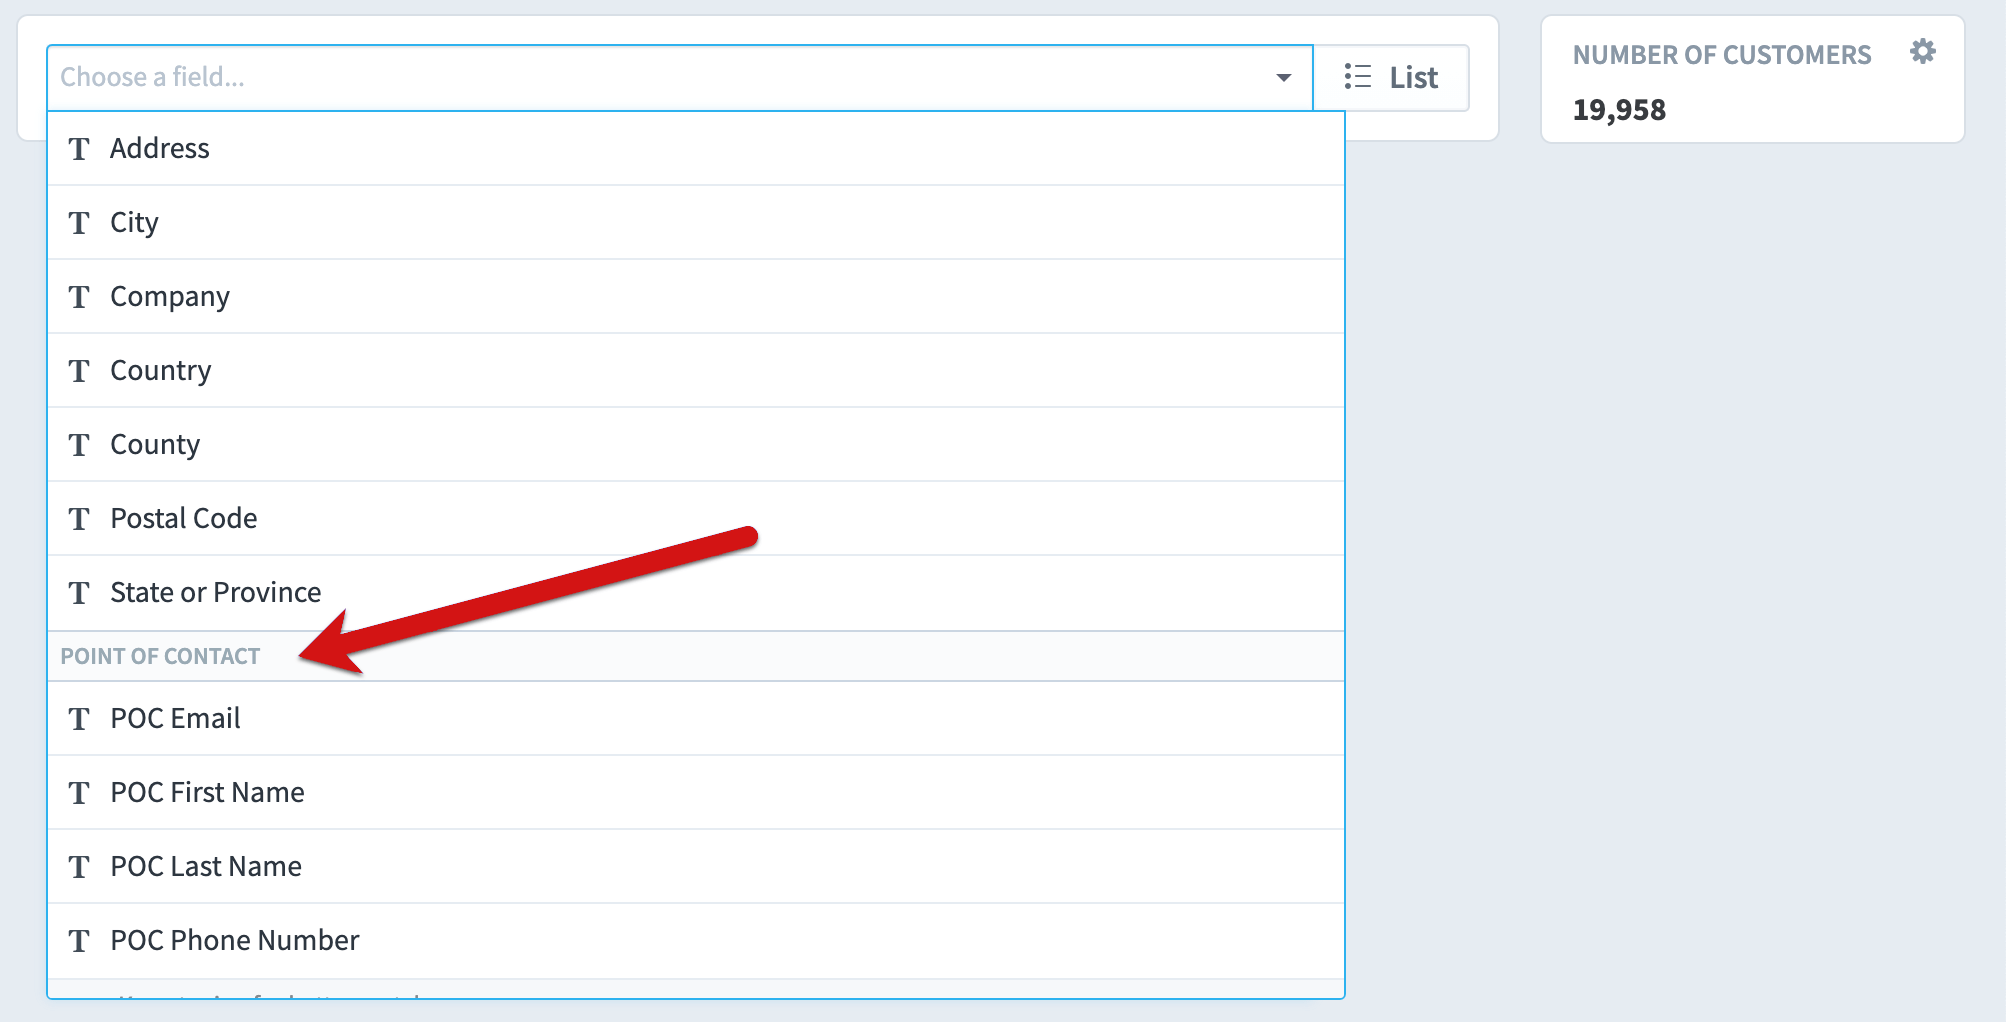
Now whenever we see a list of fields for this dataset, the Point of Contact fields will be grouped together.
Field categories and ranges
When we add the Sale Price field to the Explore tab, it lists every single unique price in the table. This isn’t particularly helpful because the most common sale price of $411 only appeared on 6 sales.

To fix this, let’s visit the dataset’s Edit tab, scroll down to the Fields table, and click on the Sale Price field’s Ranges button.
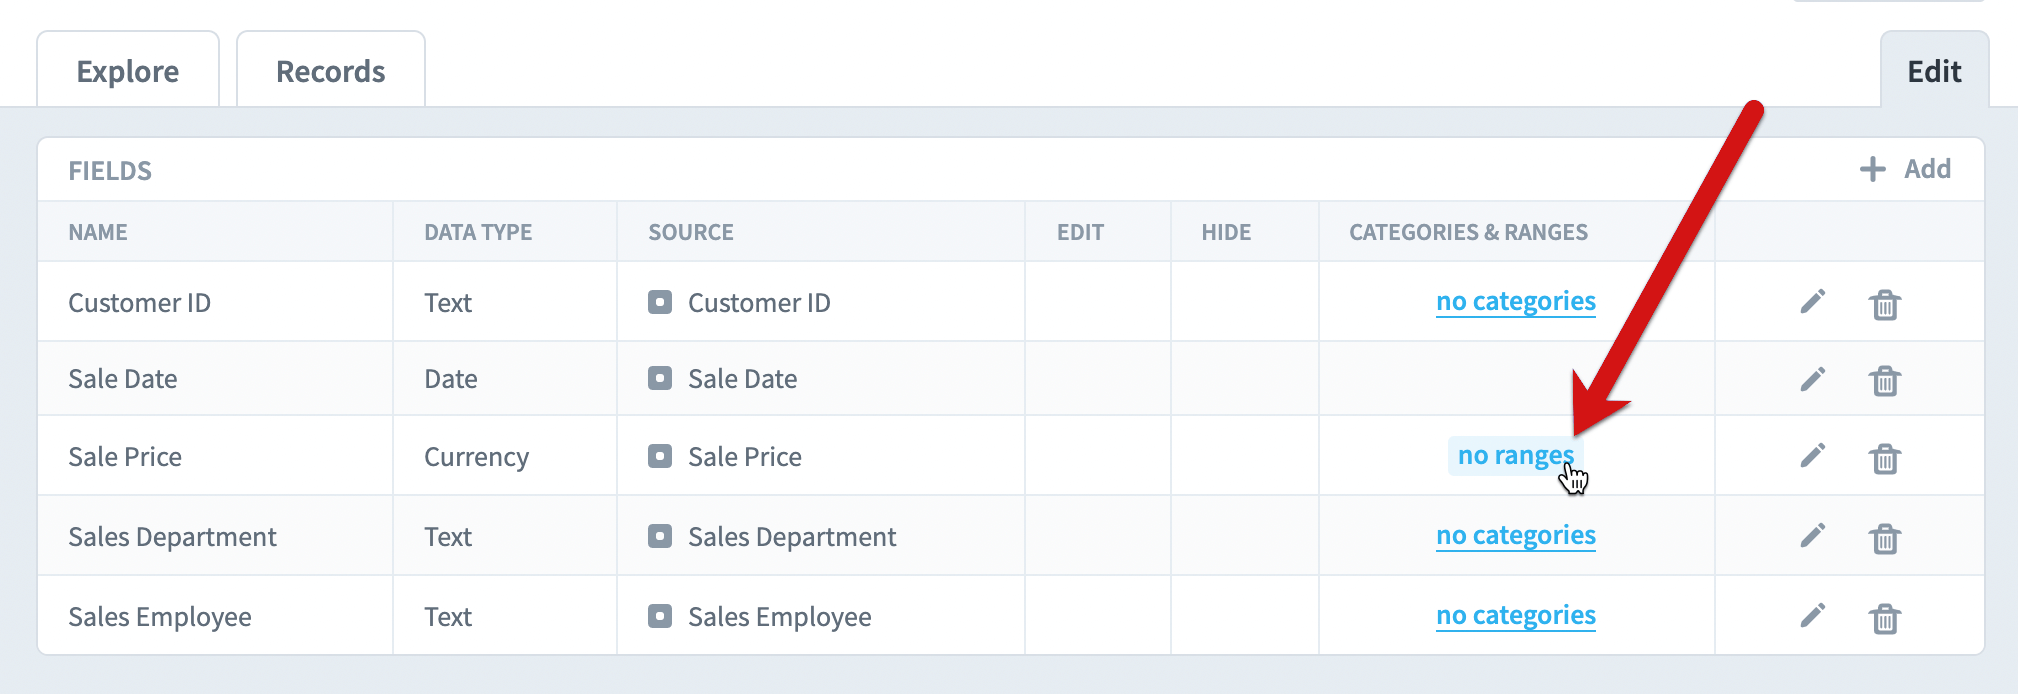
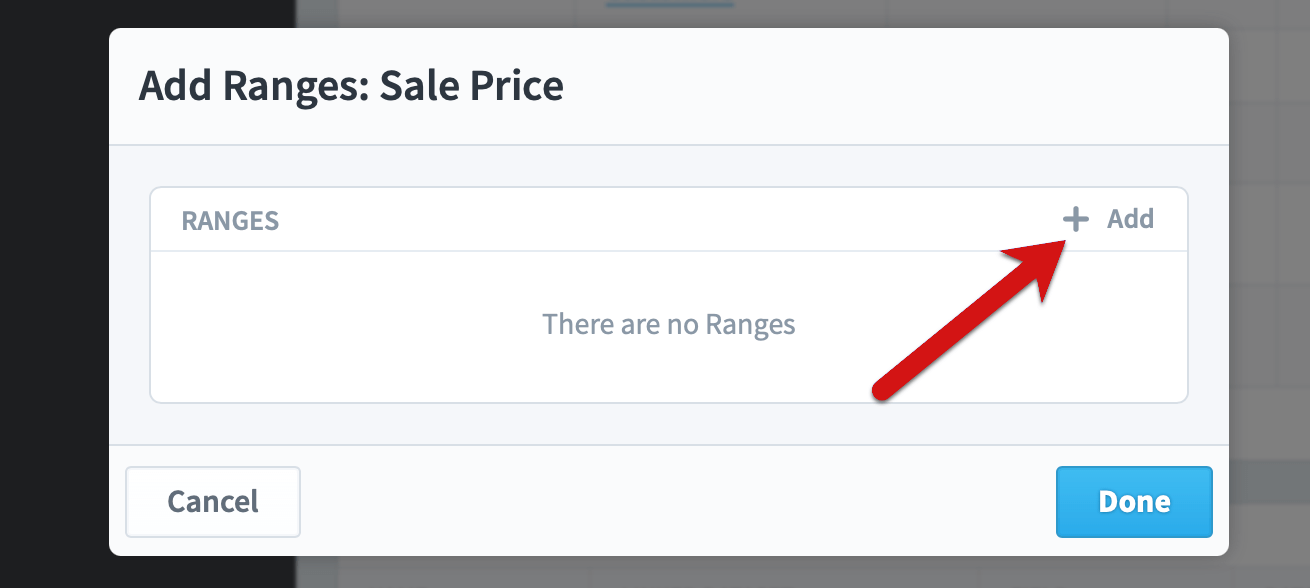
To add a range, click on the add button in the corner.
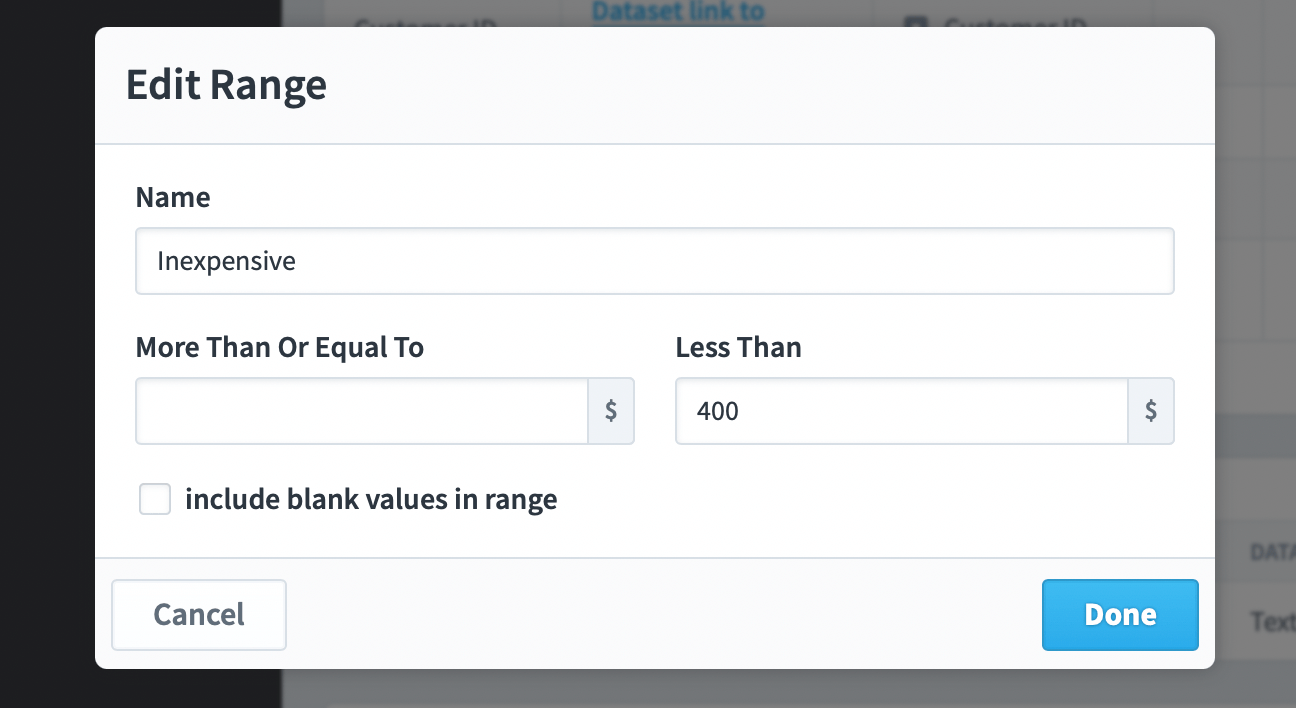
Then we’ll create our first range. In this example, the “inexpensive” range is anything less than $400.
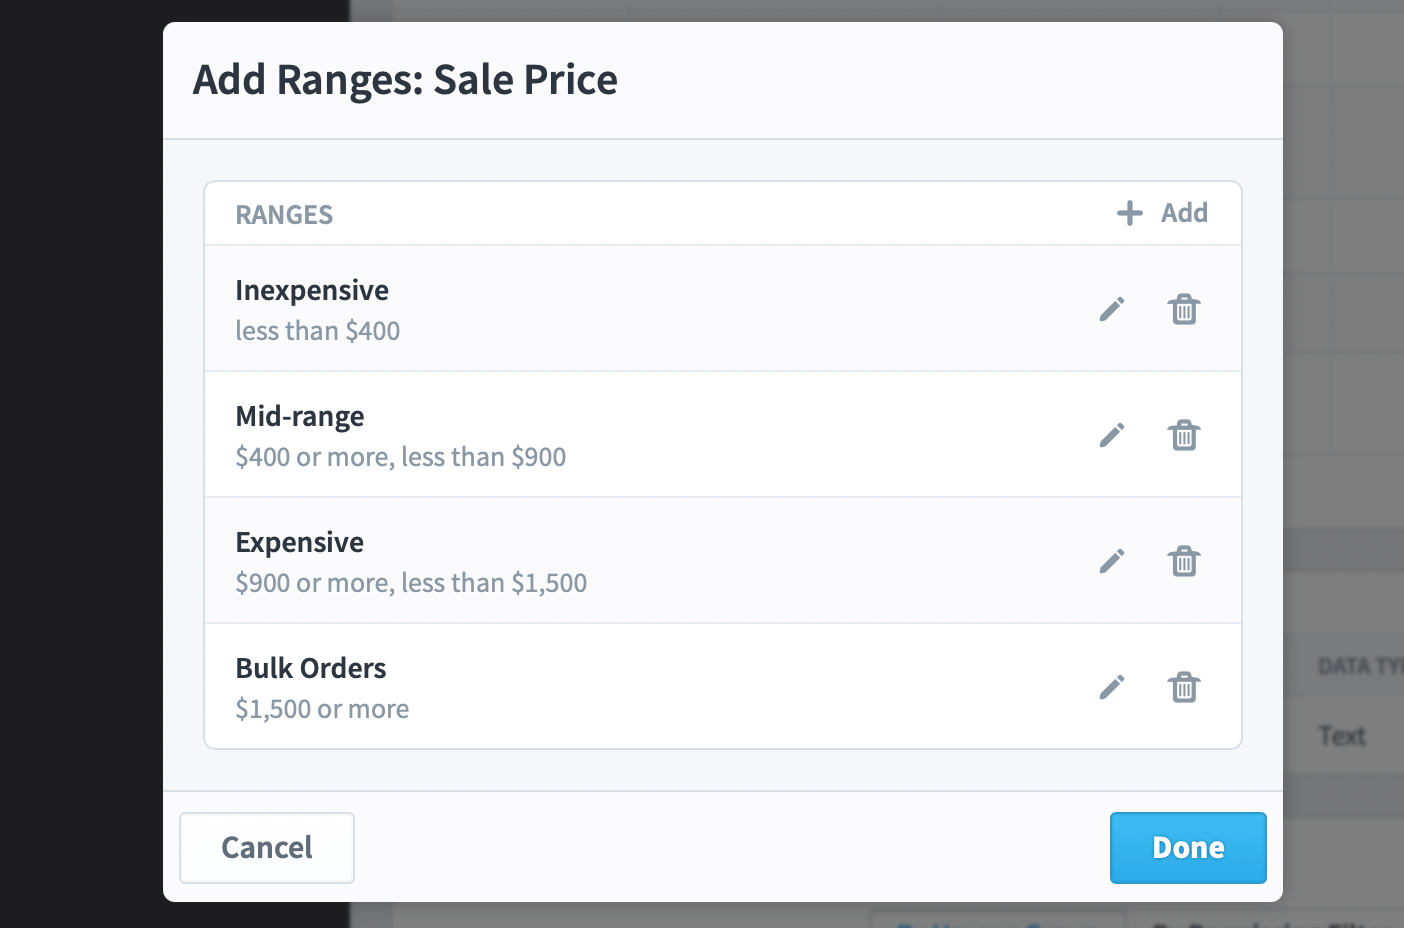
Then we’ll add three more ranges.
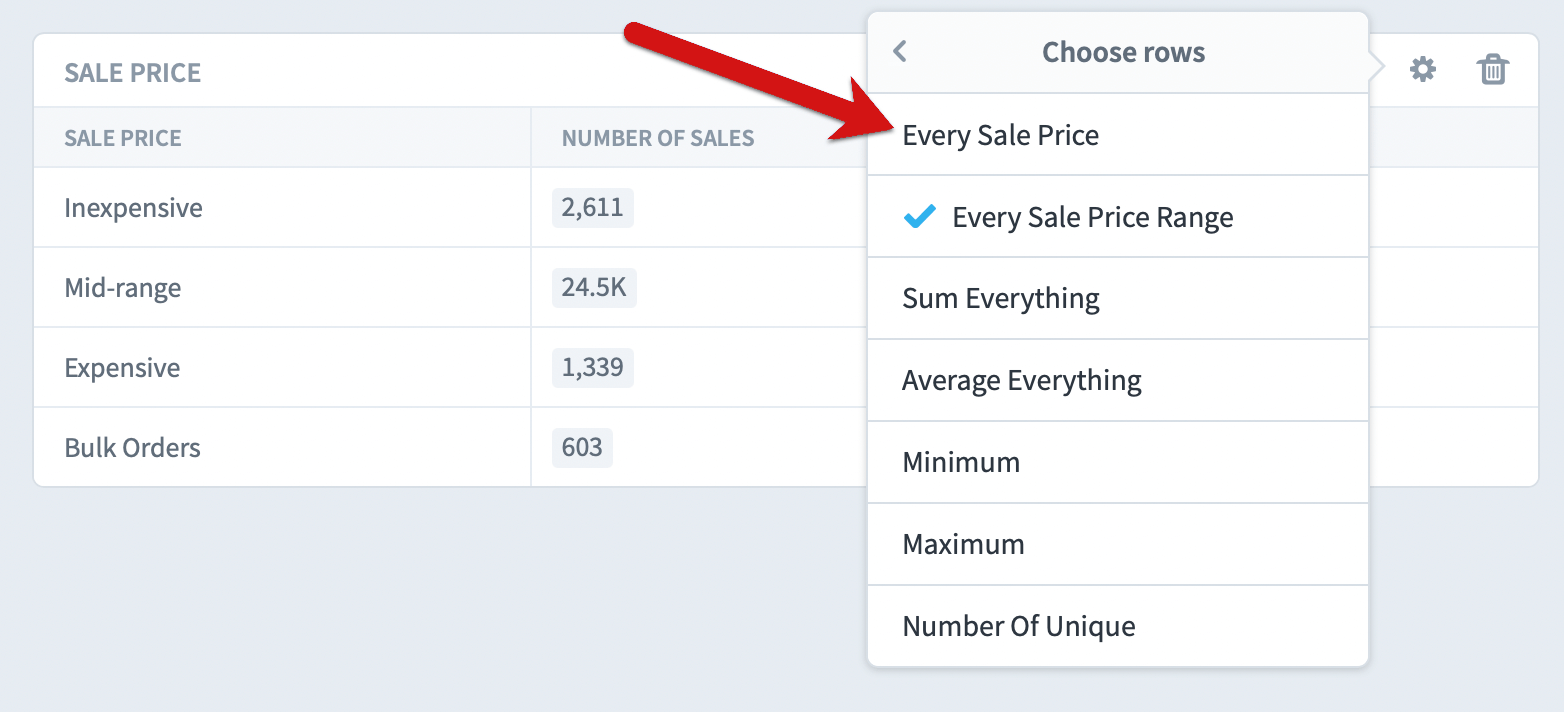
Now when we explore Sales Price, it defaults to showing the four ranges we created. This is much more usable information.

At any point you can switch back to showing every sales price.

Fields with data types like Text have categories instead of ranges.
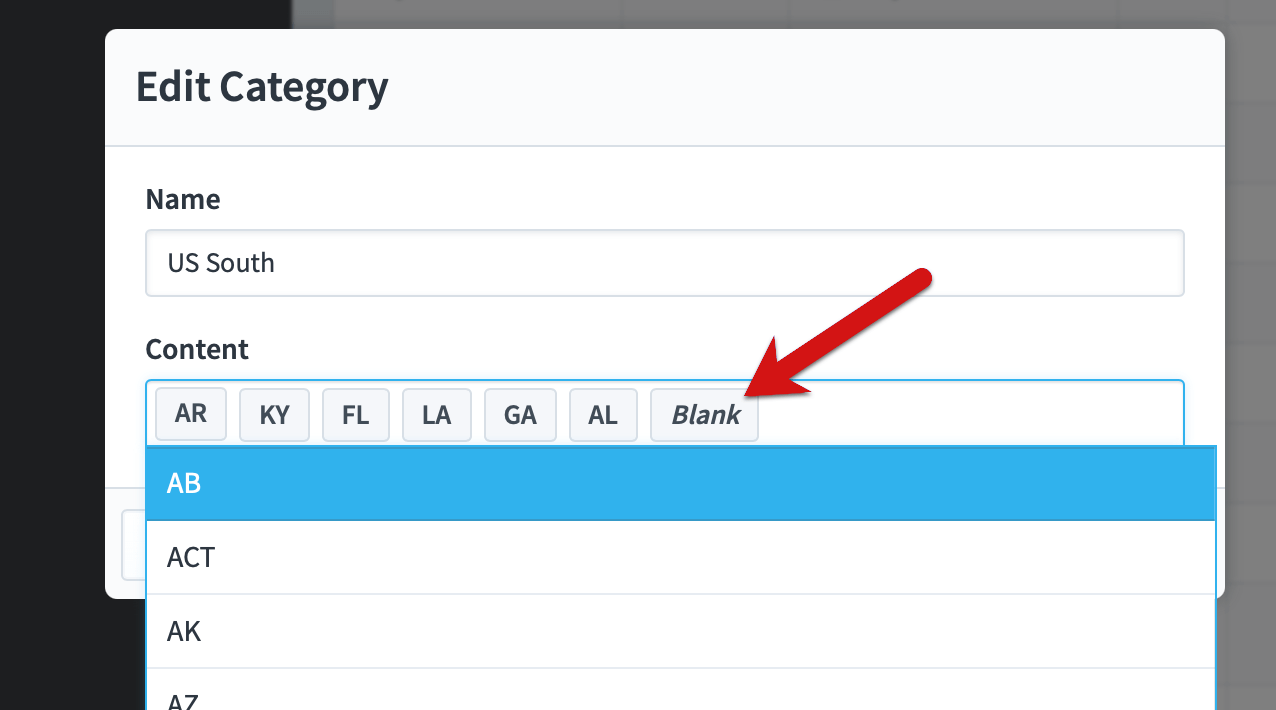
The idea is the same, but you choose specific values for every category. Note how in this category we’ve also included blank values.
