Creating a dataset KPI
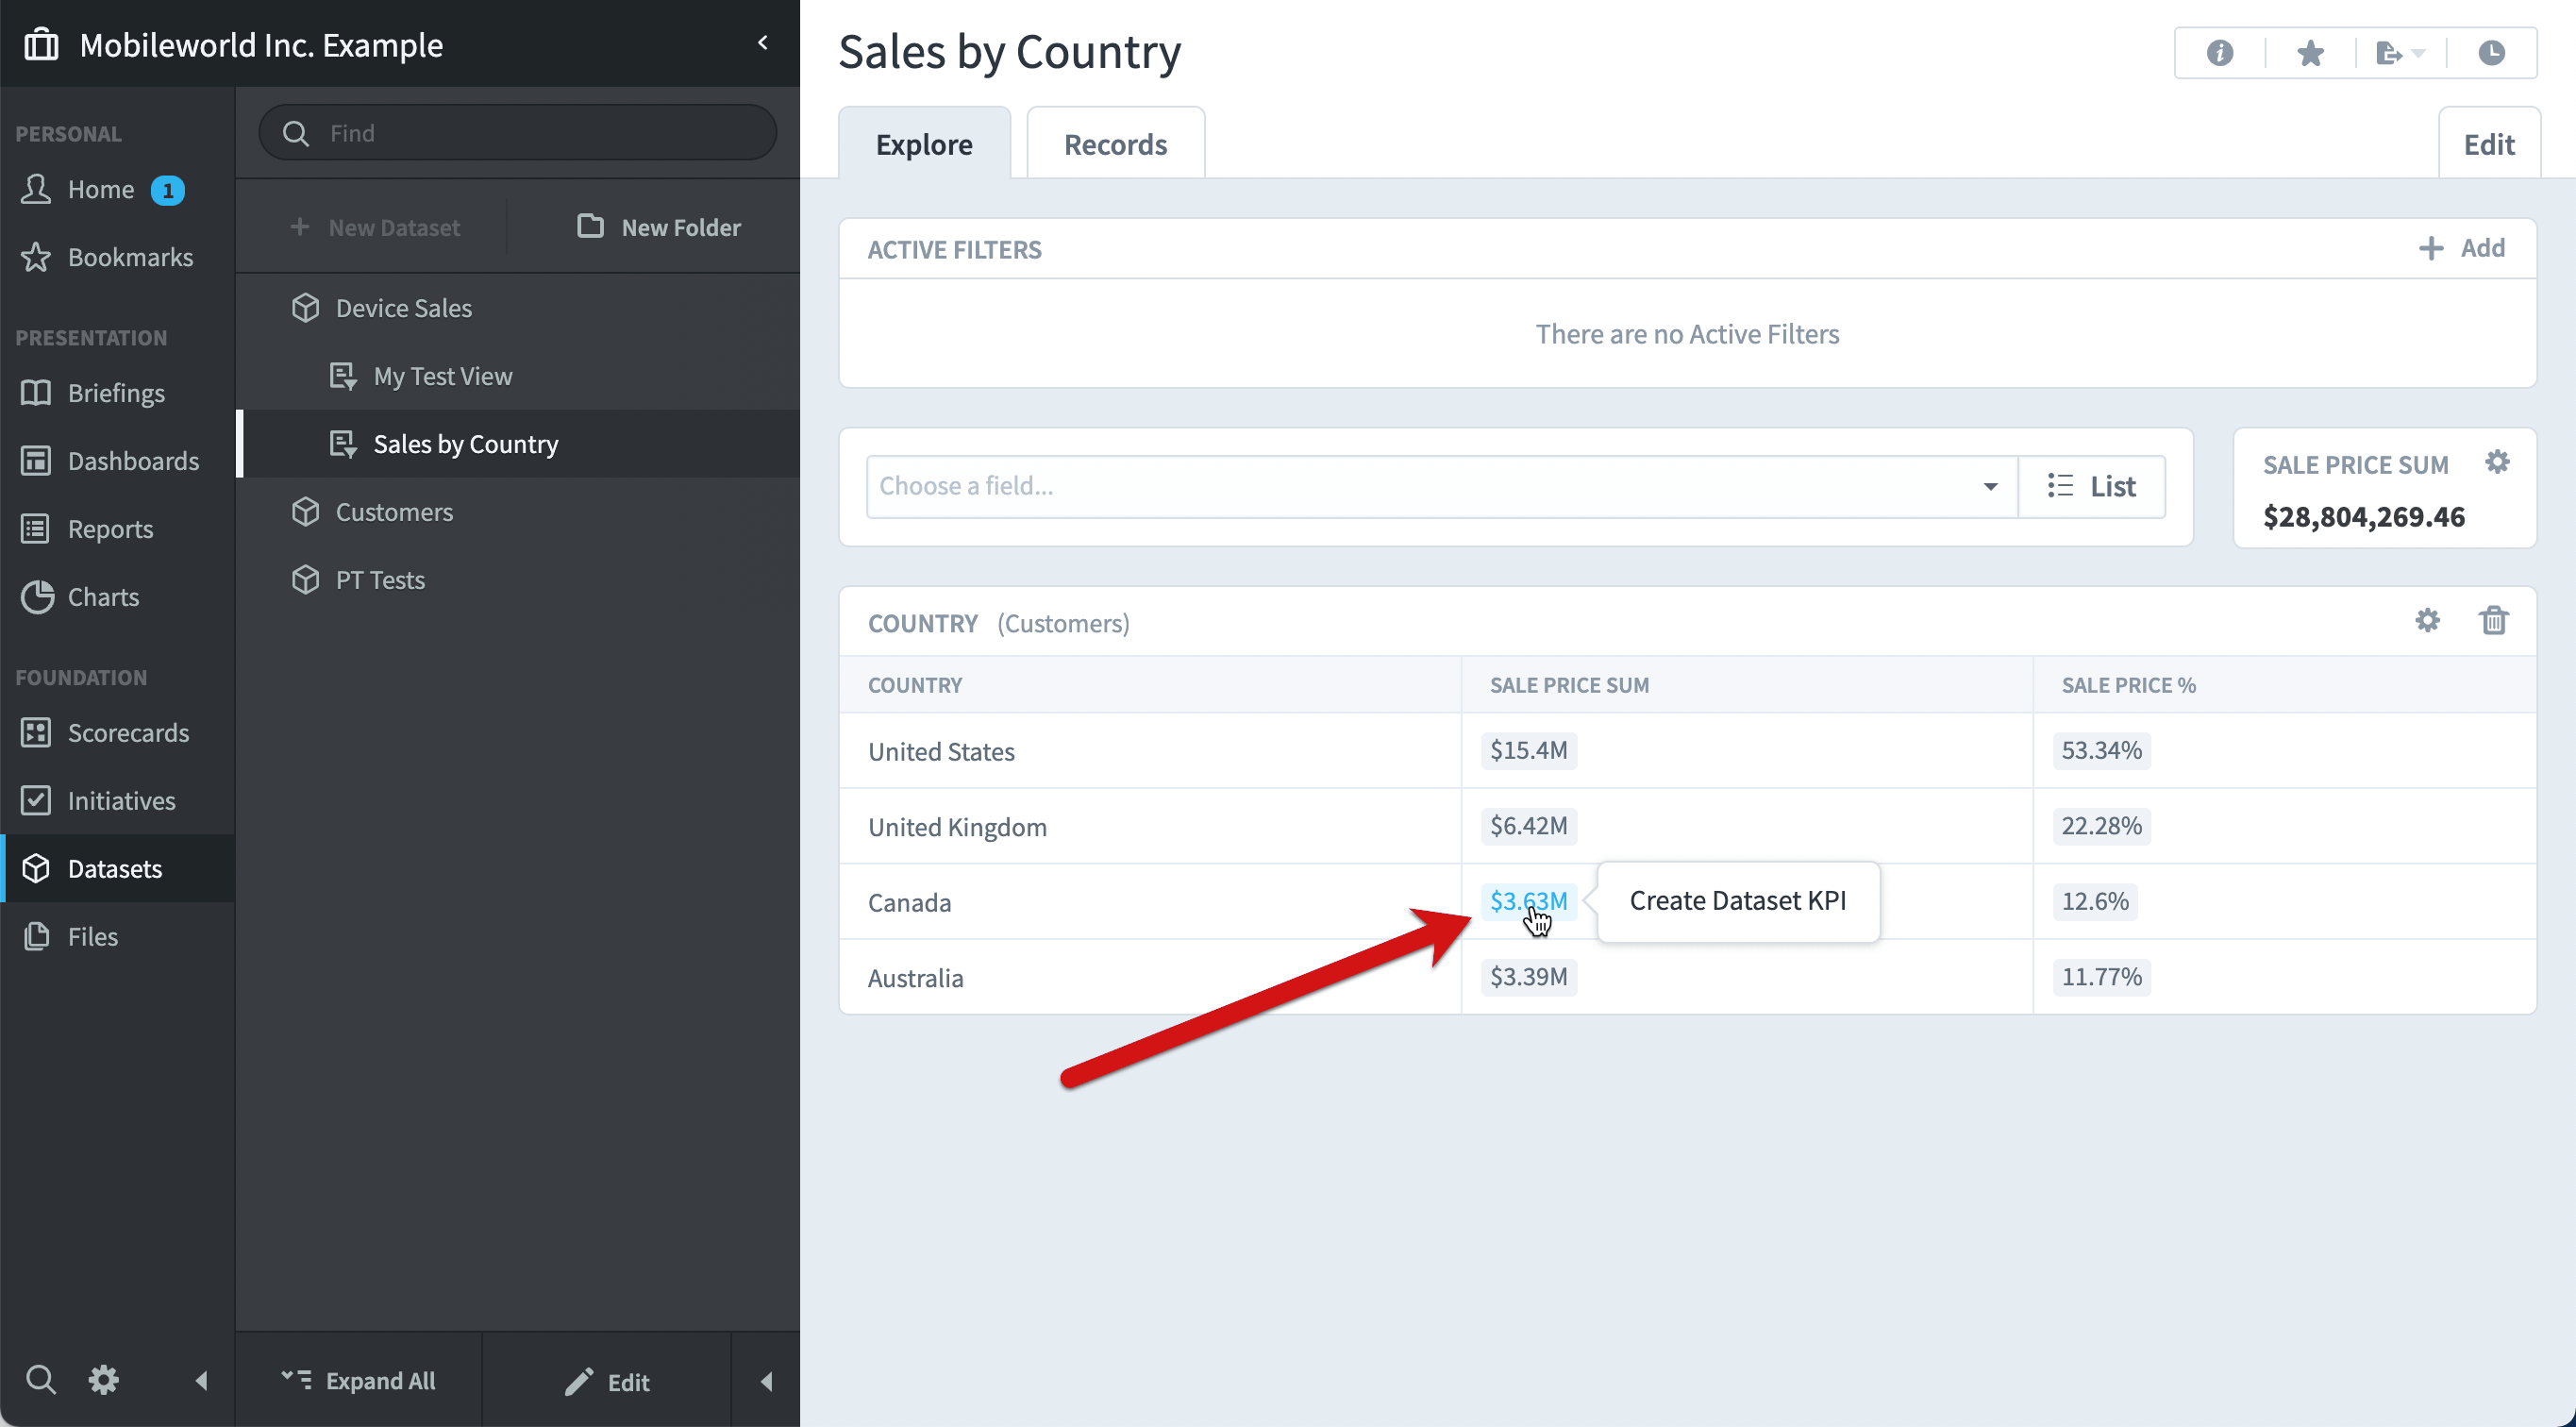
To create a KPI from dataset data, click on any number on the Datasets Explore tab, and then click the “Create Dataset KPI” link. In this example we’ll click on the $3.6M of total Canadian sales.
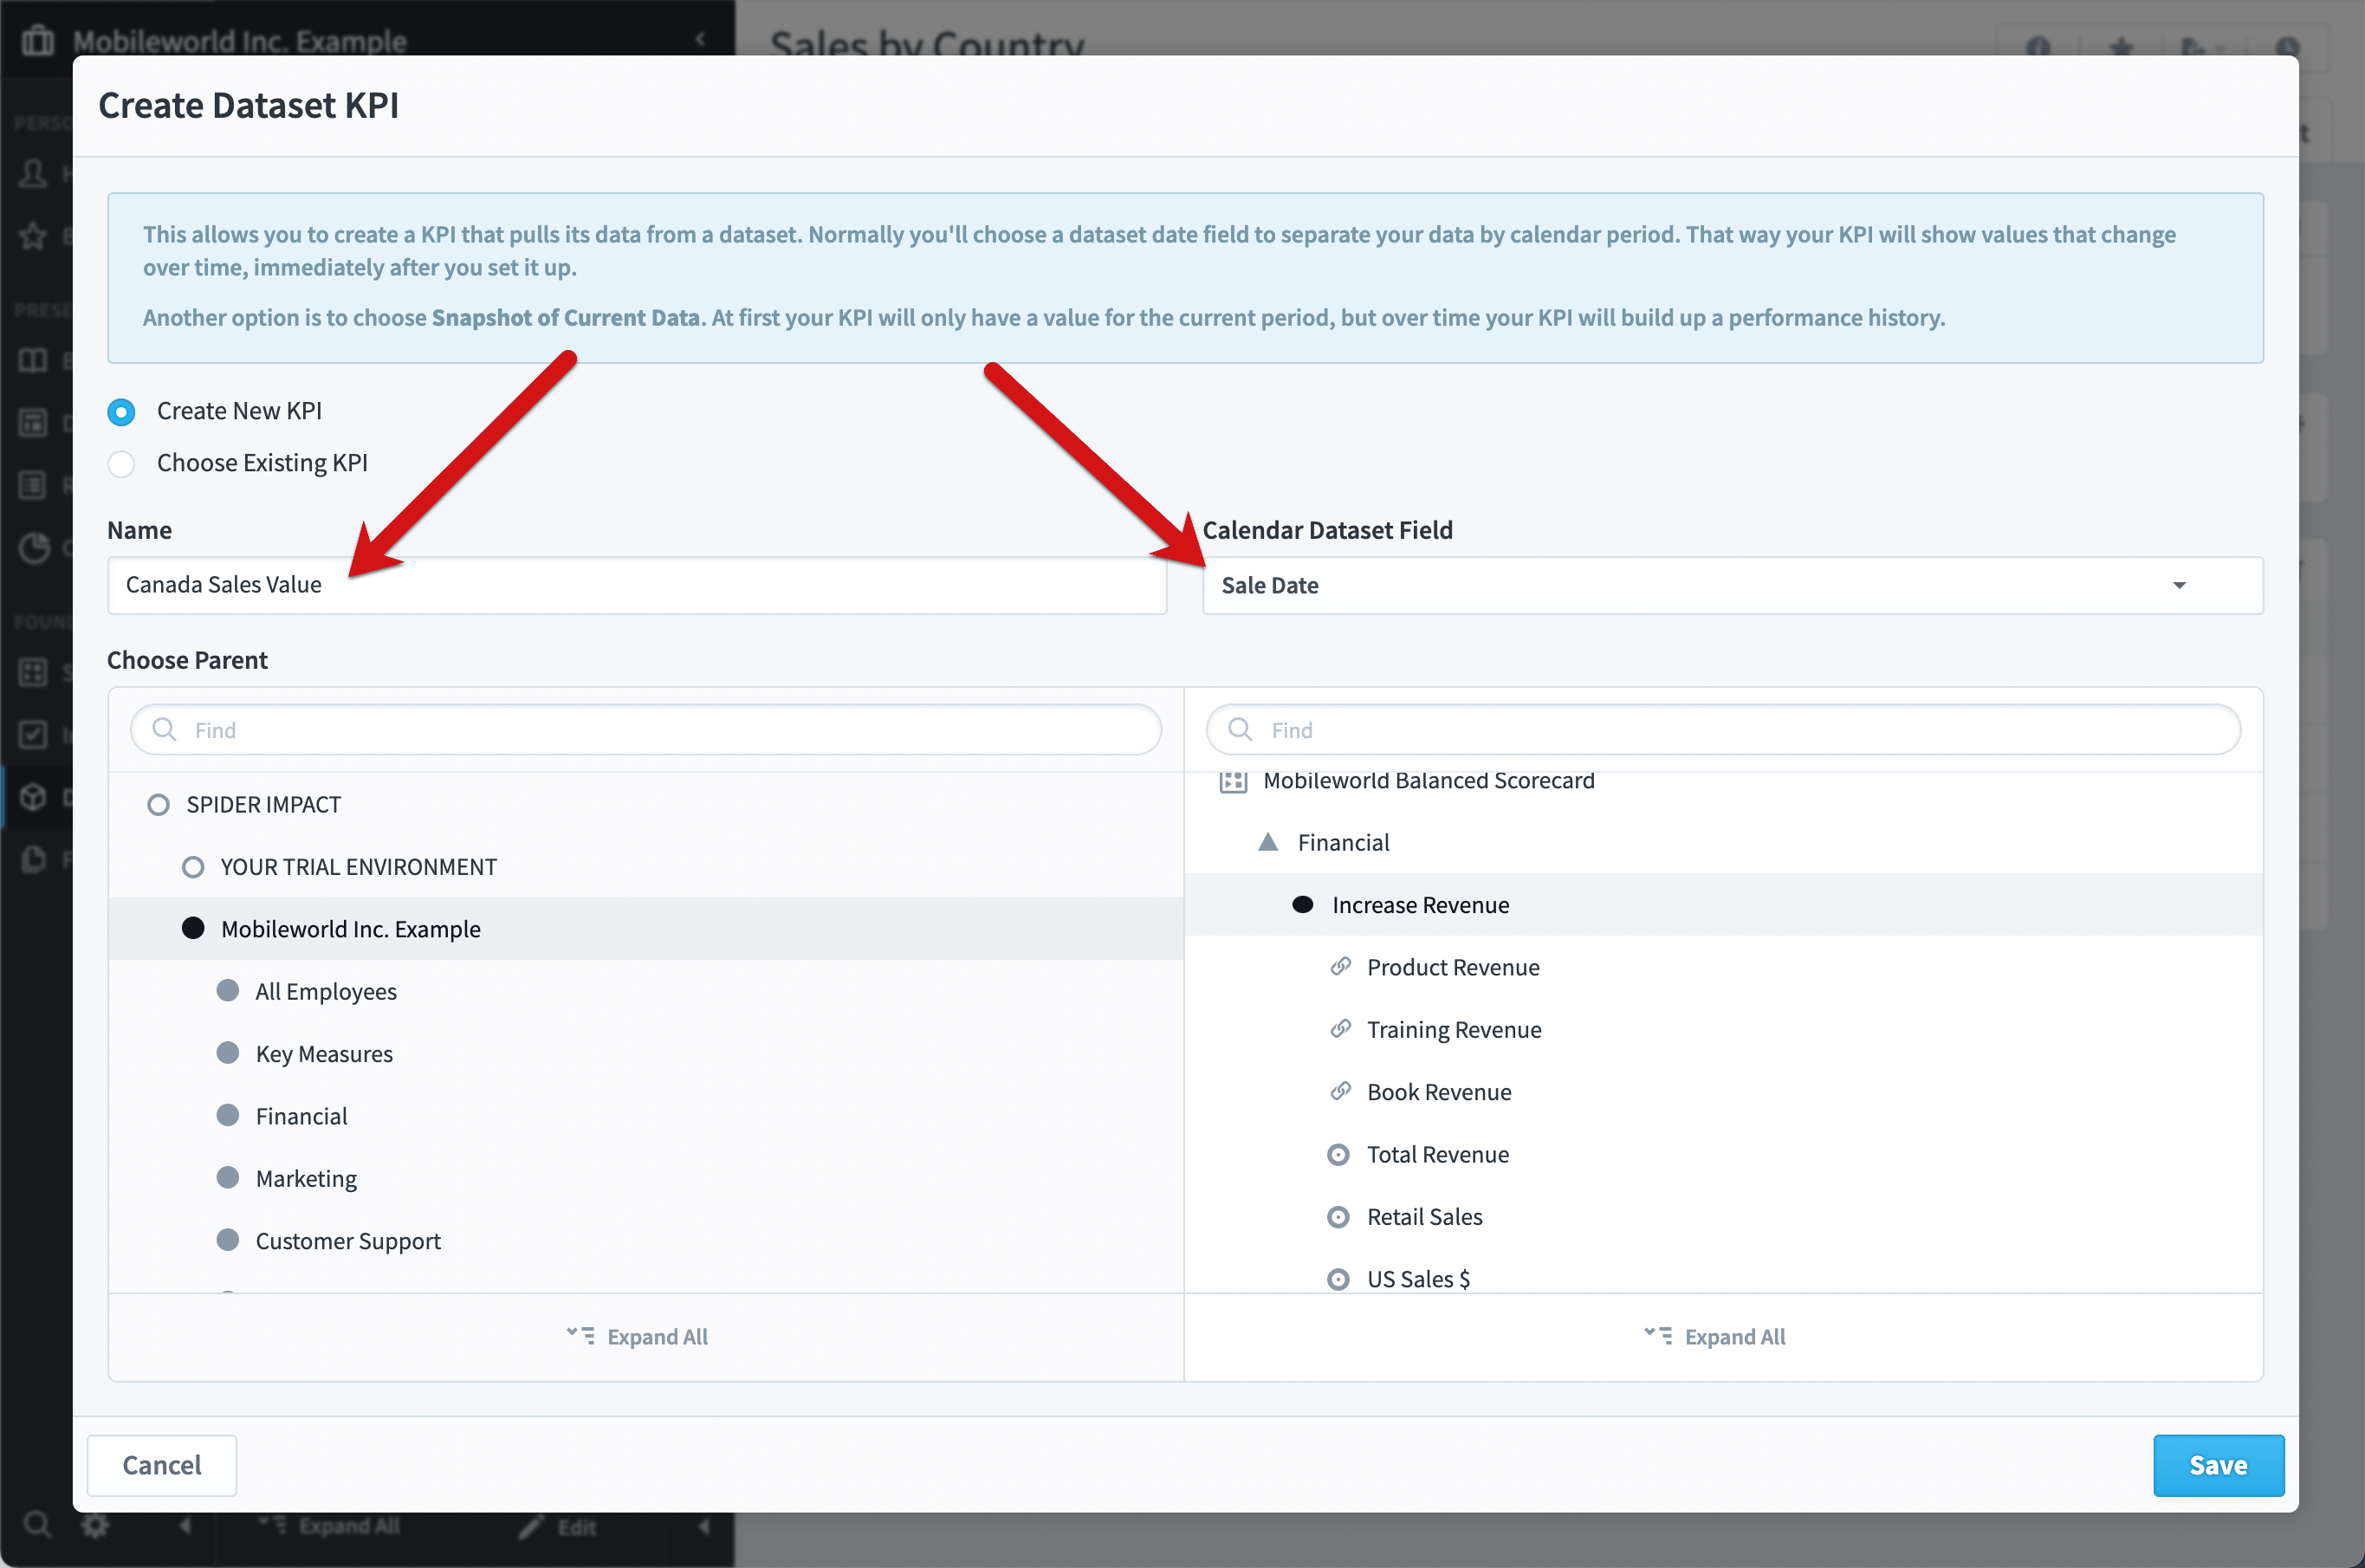
Here you can choose to create a new KPI or add data to an existing KPI. We’ll choose to create a new KPI and we’ll name it “Canada Sales Value”. We’ll also choose the Sale Date for the calendar field, and we’ll find a good place for the new KPI to go.
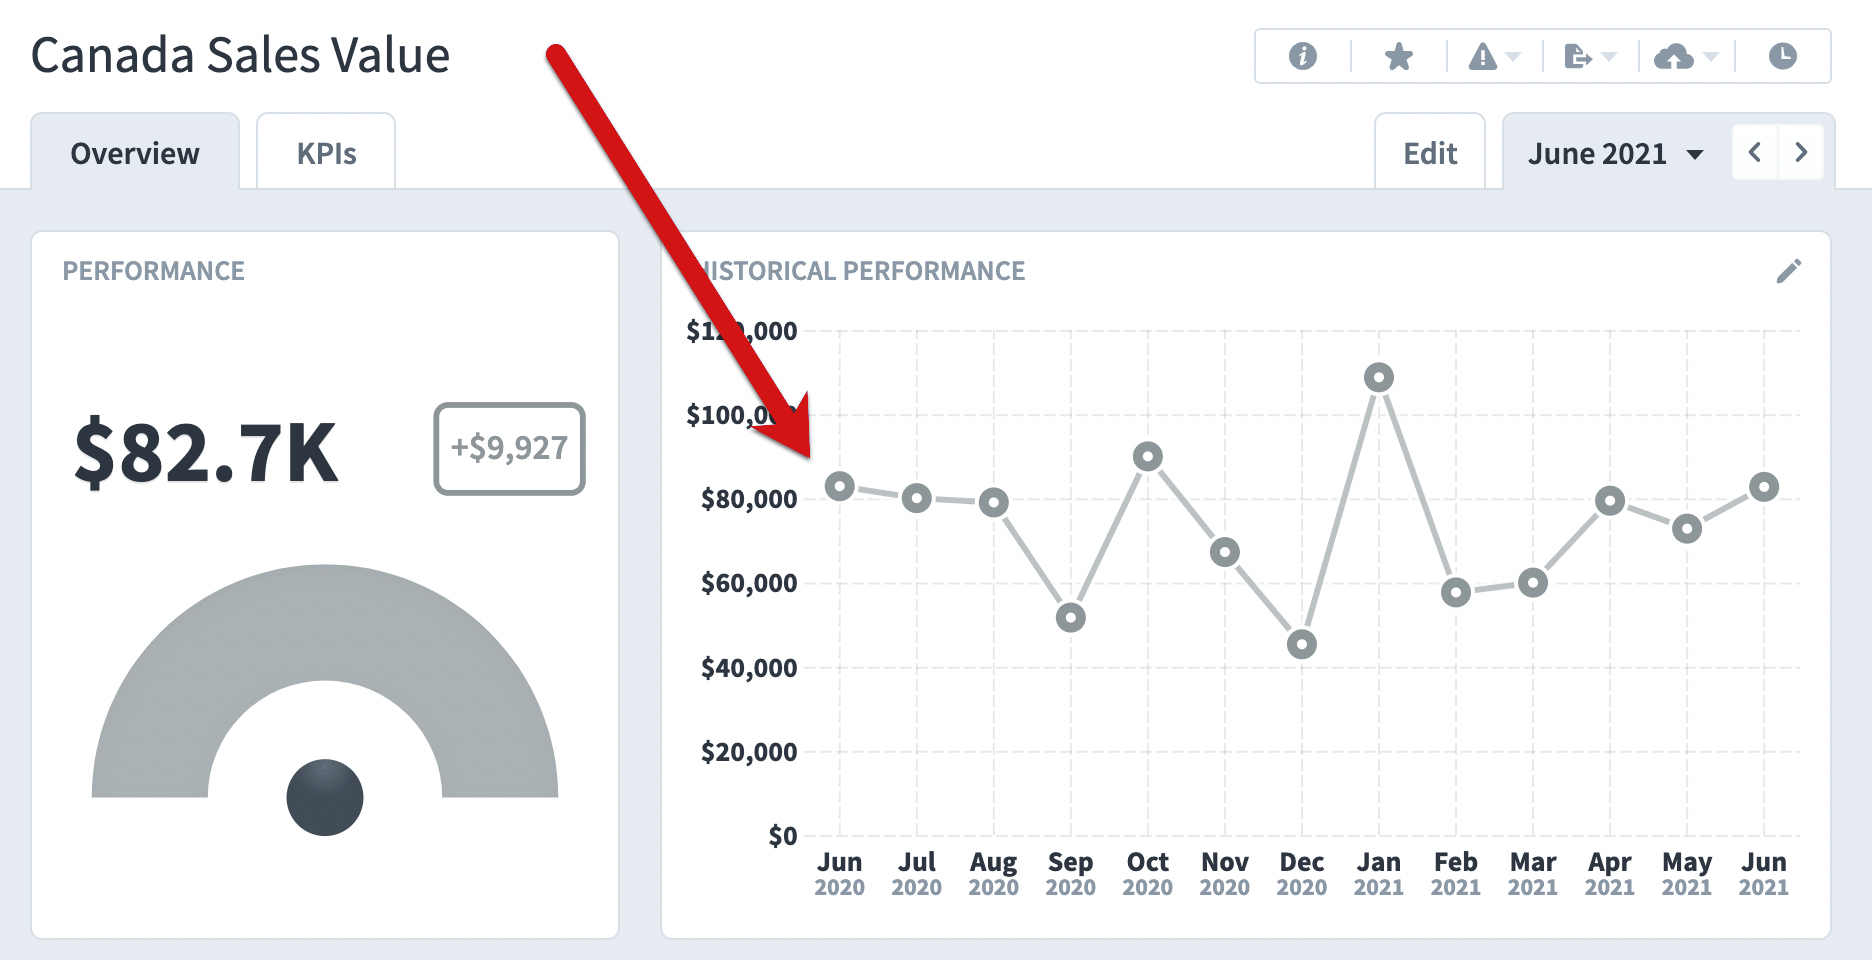
After saving the new KPI, it looks like this. The $3.6M in total Canada sales has been broken into months using the Sale Date field. In a few clicks we’ve created a KPI with data going back years. Even better, whenever the dataset is updated with new data, the KPI will automatically update.
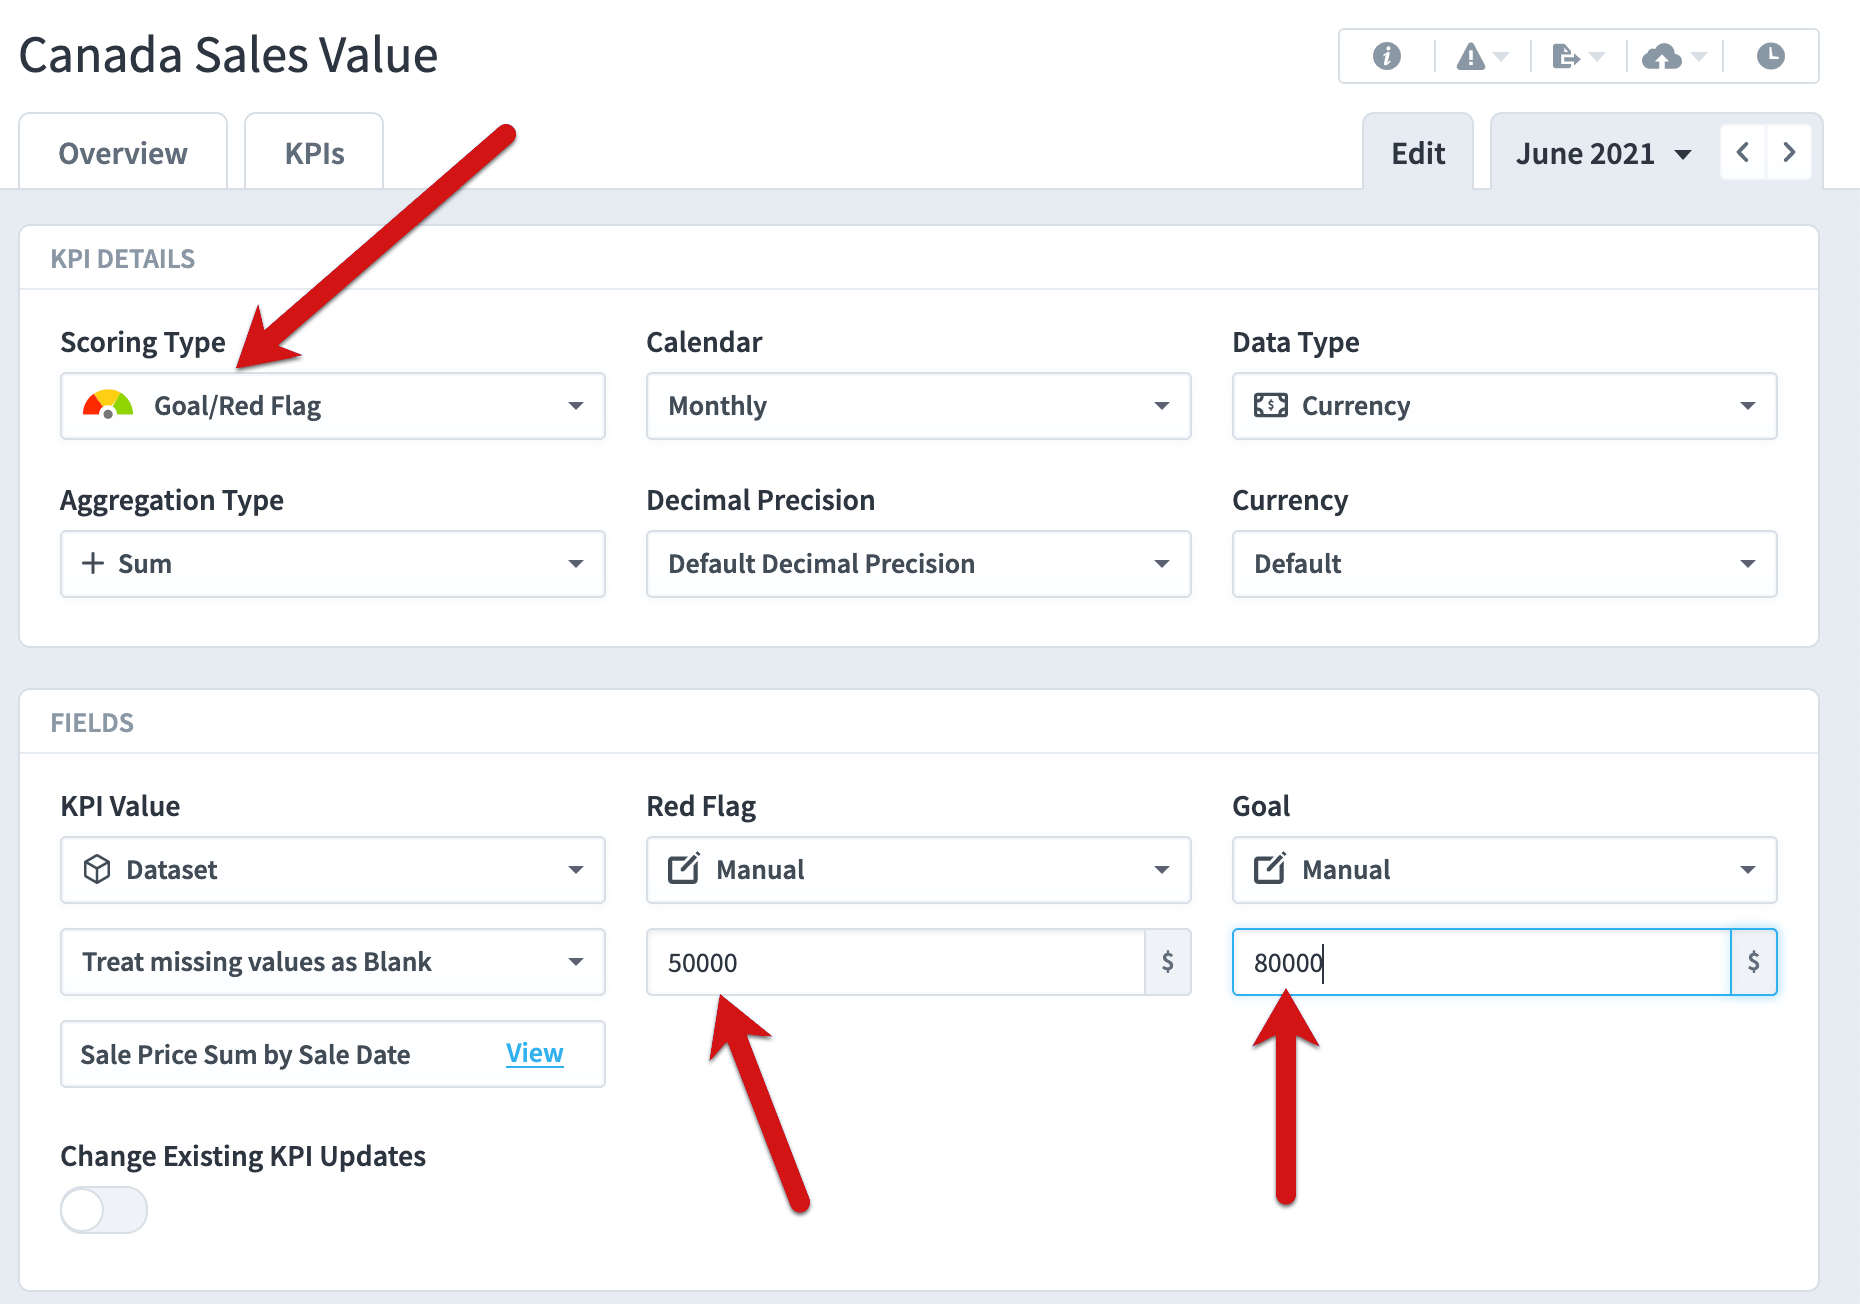
This dataset KPI is just like any other KPI, and we can give it thresholds if we want.
Now our KPI has colors, and we can create performance alerts. When you hover over the KPI value, you can see exactly where the data comes from.
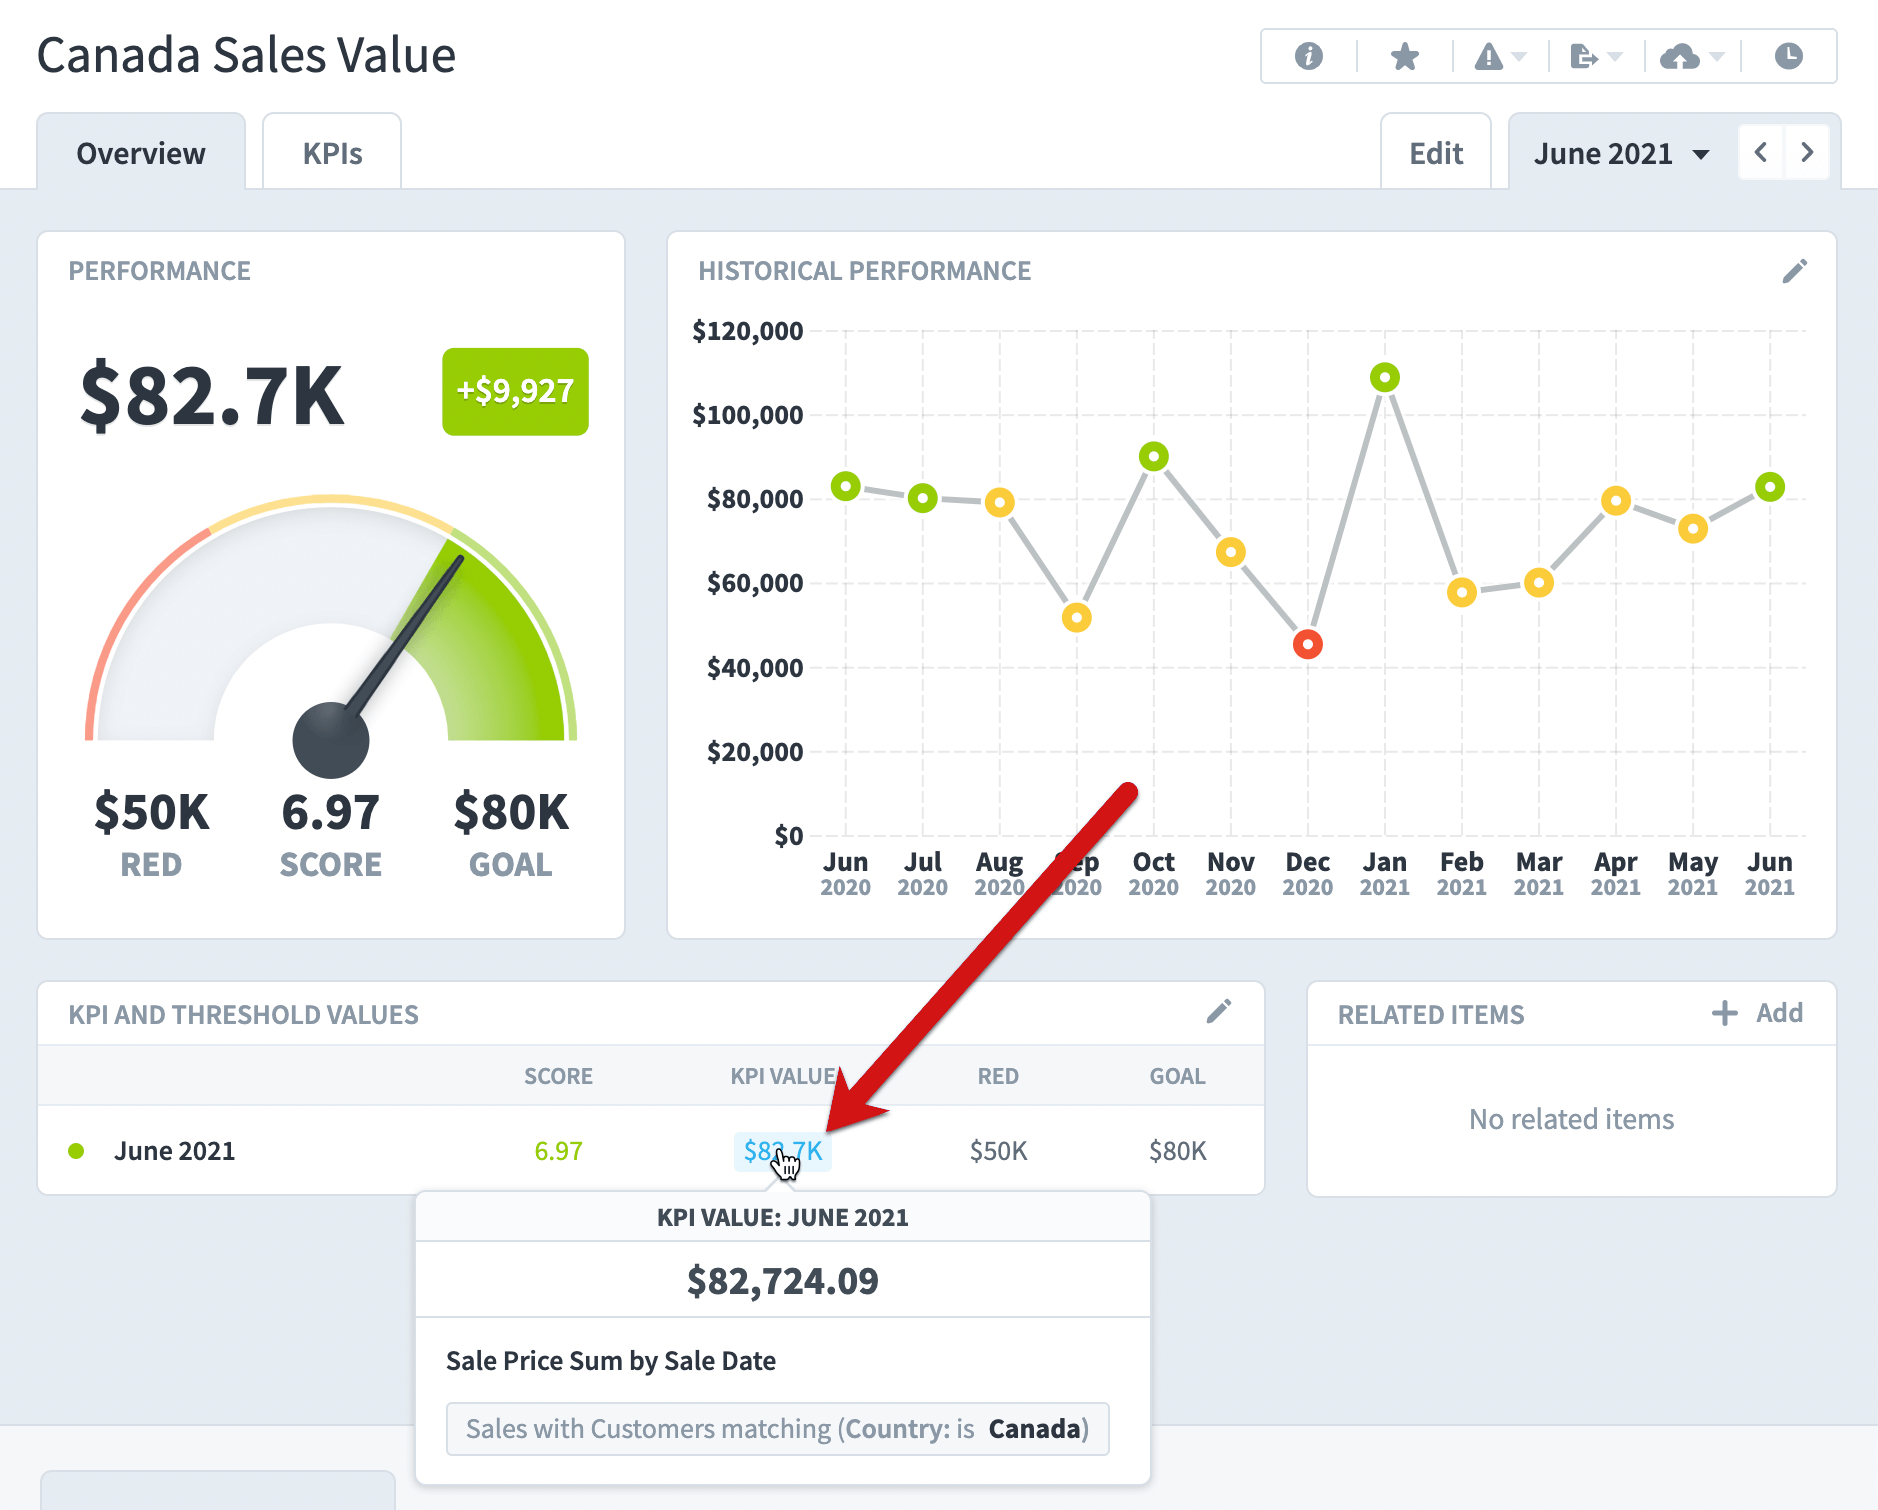
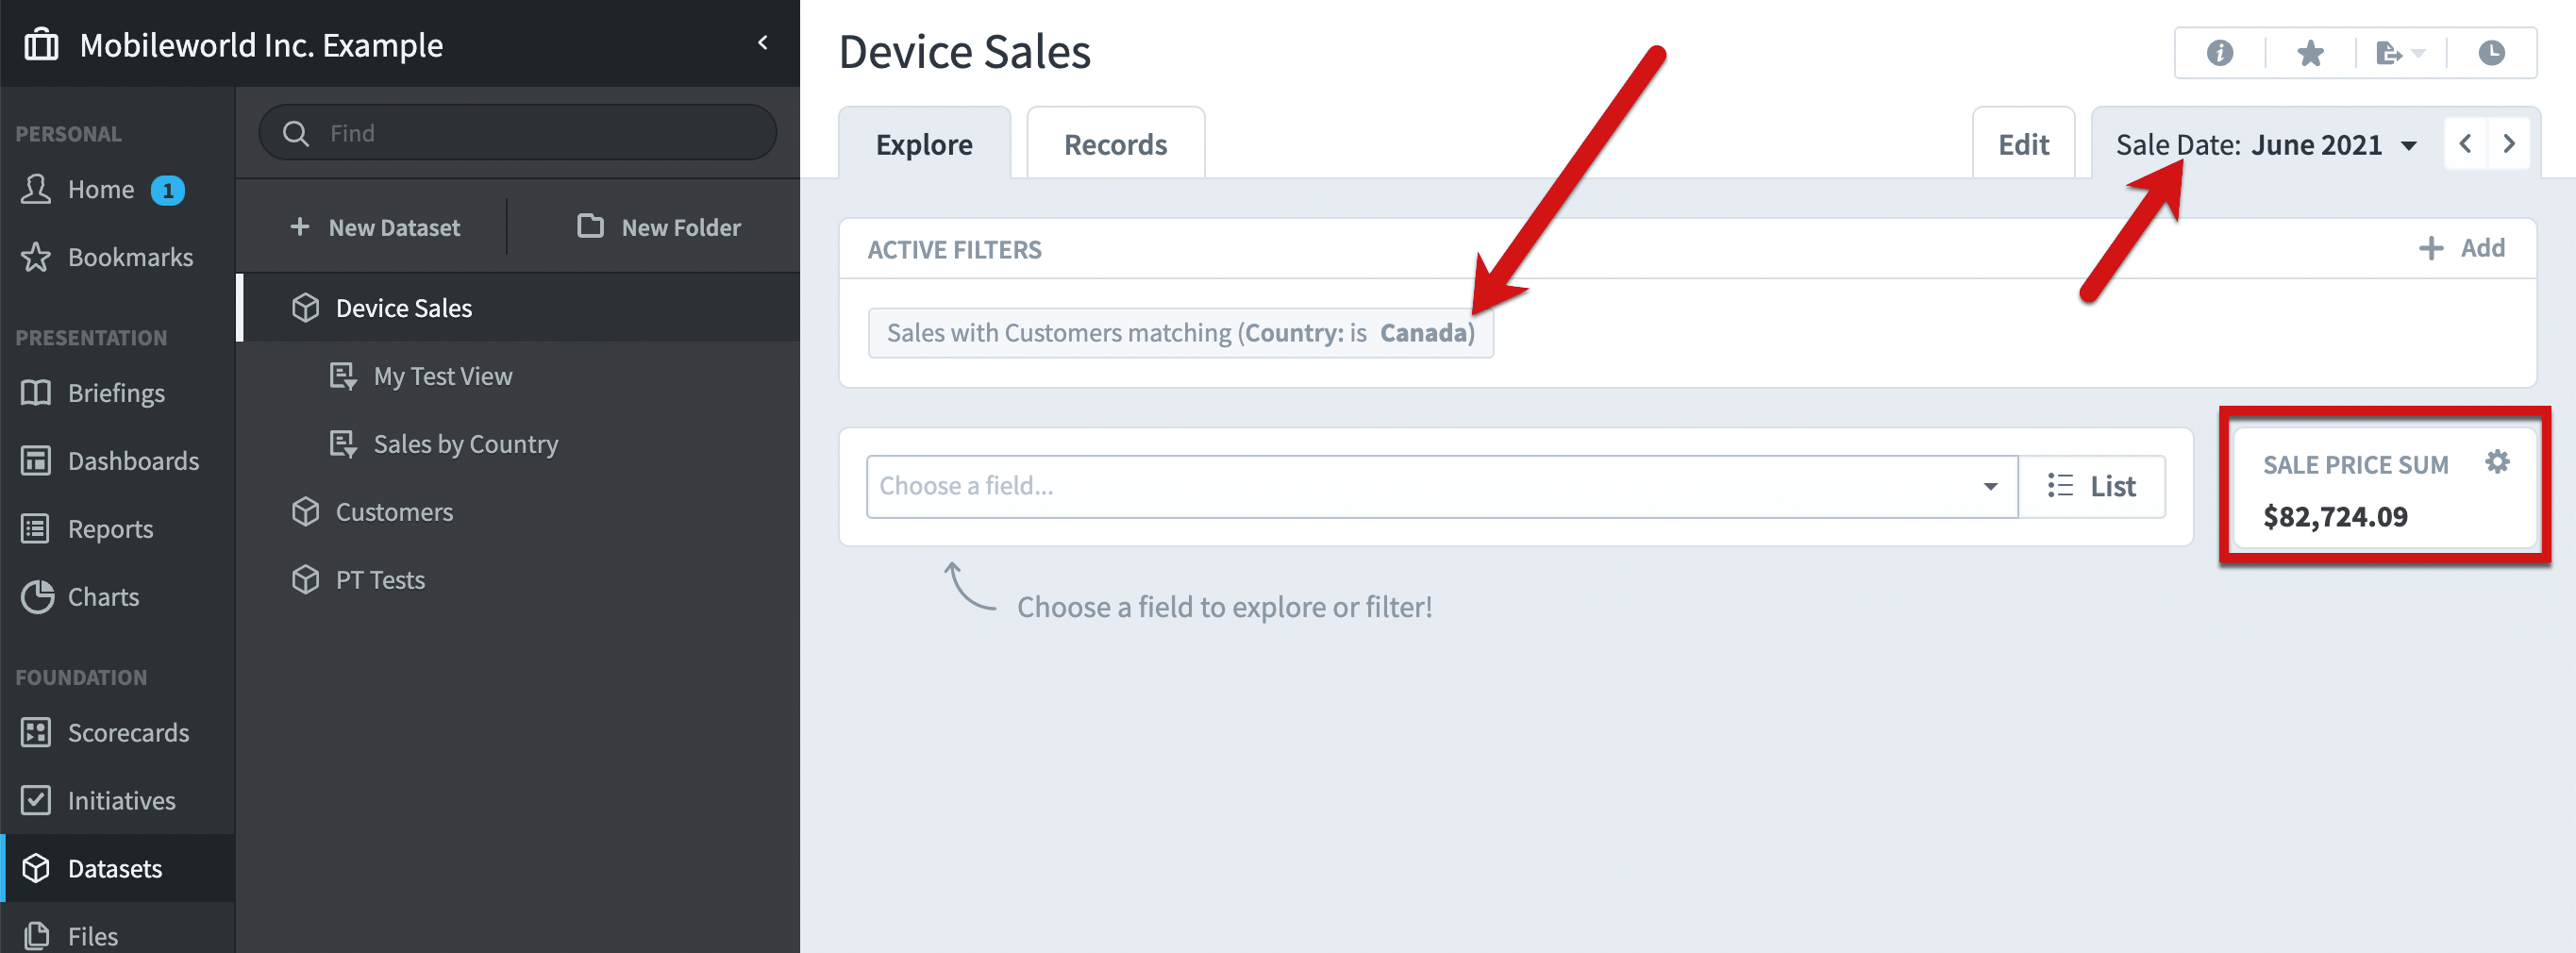
If you click on the KPI value on the Scorecards Overview, you drill down to the Datasets Explore tab for further exploration. Here we have the “Country = Canada” filter automatically applied, with the date set to “June 2021”.
Snapshot dataset KPIs
Let’s create another dataset KPI.

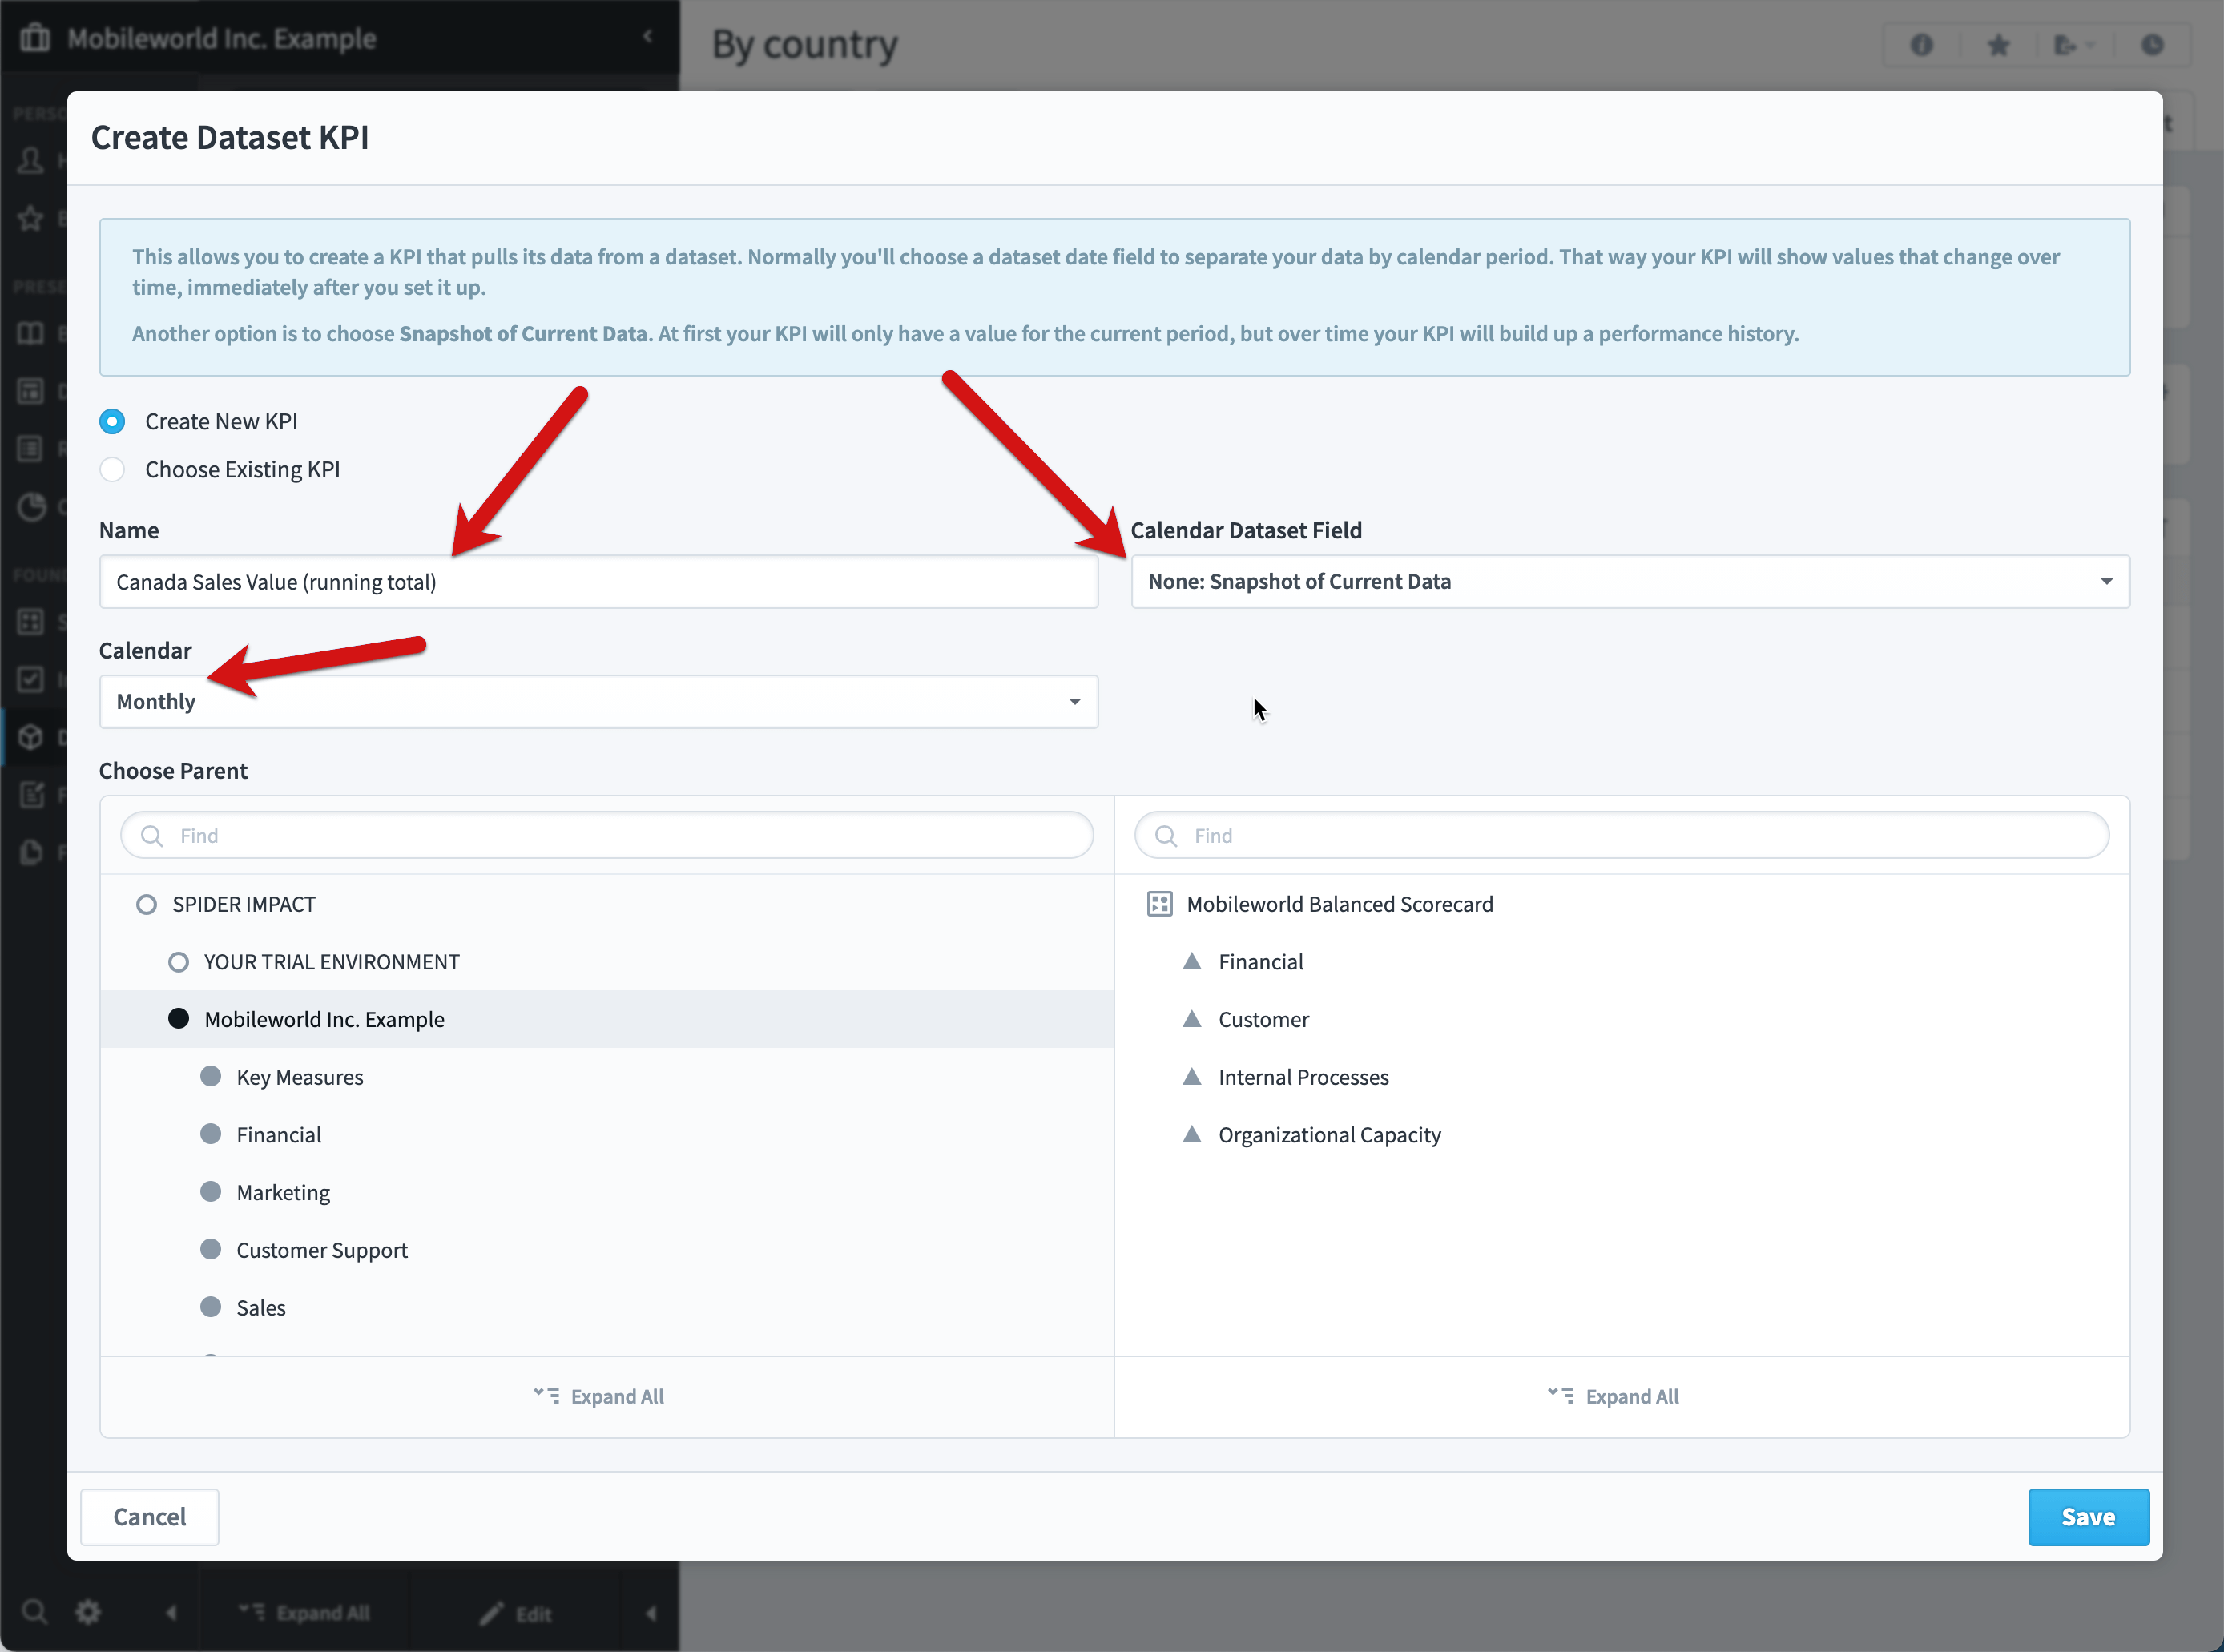
In the previous example we chose Sale Date for the calendar field, but this time we’re not going to choose any date field. Instead, we’re going to make a new snapshot KPI.
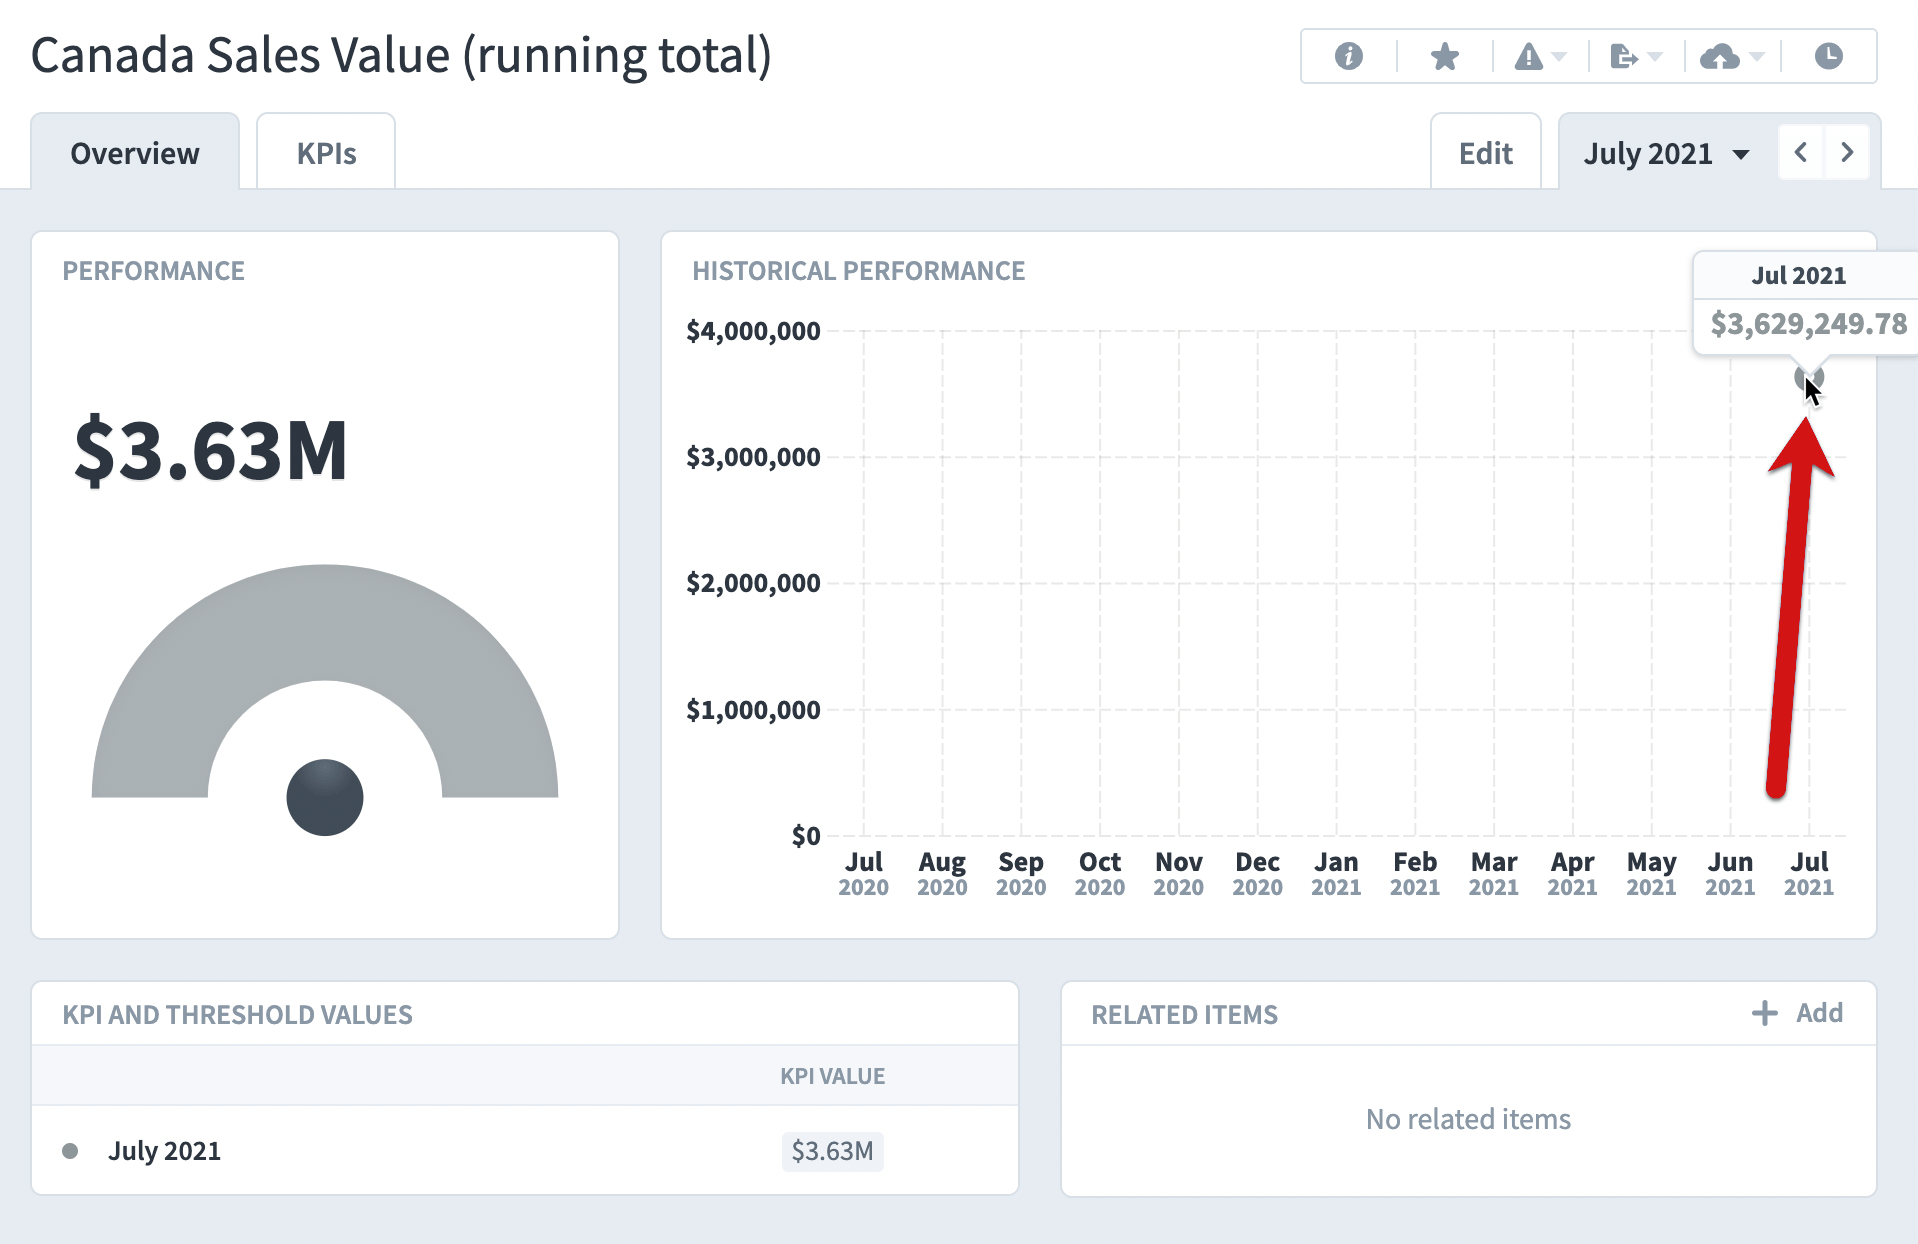
Rather than spreading the $3.6M over time, it saves the entire value in the current month of July 2021. Then, at the beginning of the next month, Spider Impact will save whatever the total is at that time for August 2021. Over time the KPI will build a performance history.
Snapshot KPIs are often used when the data source doesn’t contain historical data. For example, we may have an HR system that only contains information about our current employees. If we had a “Number of Employees” KPI, we’d create a snapshot that updates based on the total employees in our HR system.
Spider Impact manages all snapshot KPIs for you, but if you’re curious, here’s how the process works.
Every day, early in the morning, Impact looks to see if a new calendar period started. If so, it will create a new snapshot value. For example, if it’s the first day of the month, all monthly KPIs will get new snapshot values. Whenever the dataset is updated with new data, it will also immediately update the current period for all of its dataset KPIs. Finally, when an administrator manually rebuilds the dataset, the snapshot KPI values for the current period are replaced.
It’s important to note that Impact updates the data in the current period, not the previous period. By default, however, Impact shows the previous period when you log in. That means you’ll often have to move one period forward to see the latest snapshot values.
