Please see the Overview of Datasets article for information about what datasets are, and how to add and filter fields on the Datasets Explore tab.
Advanced filters
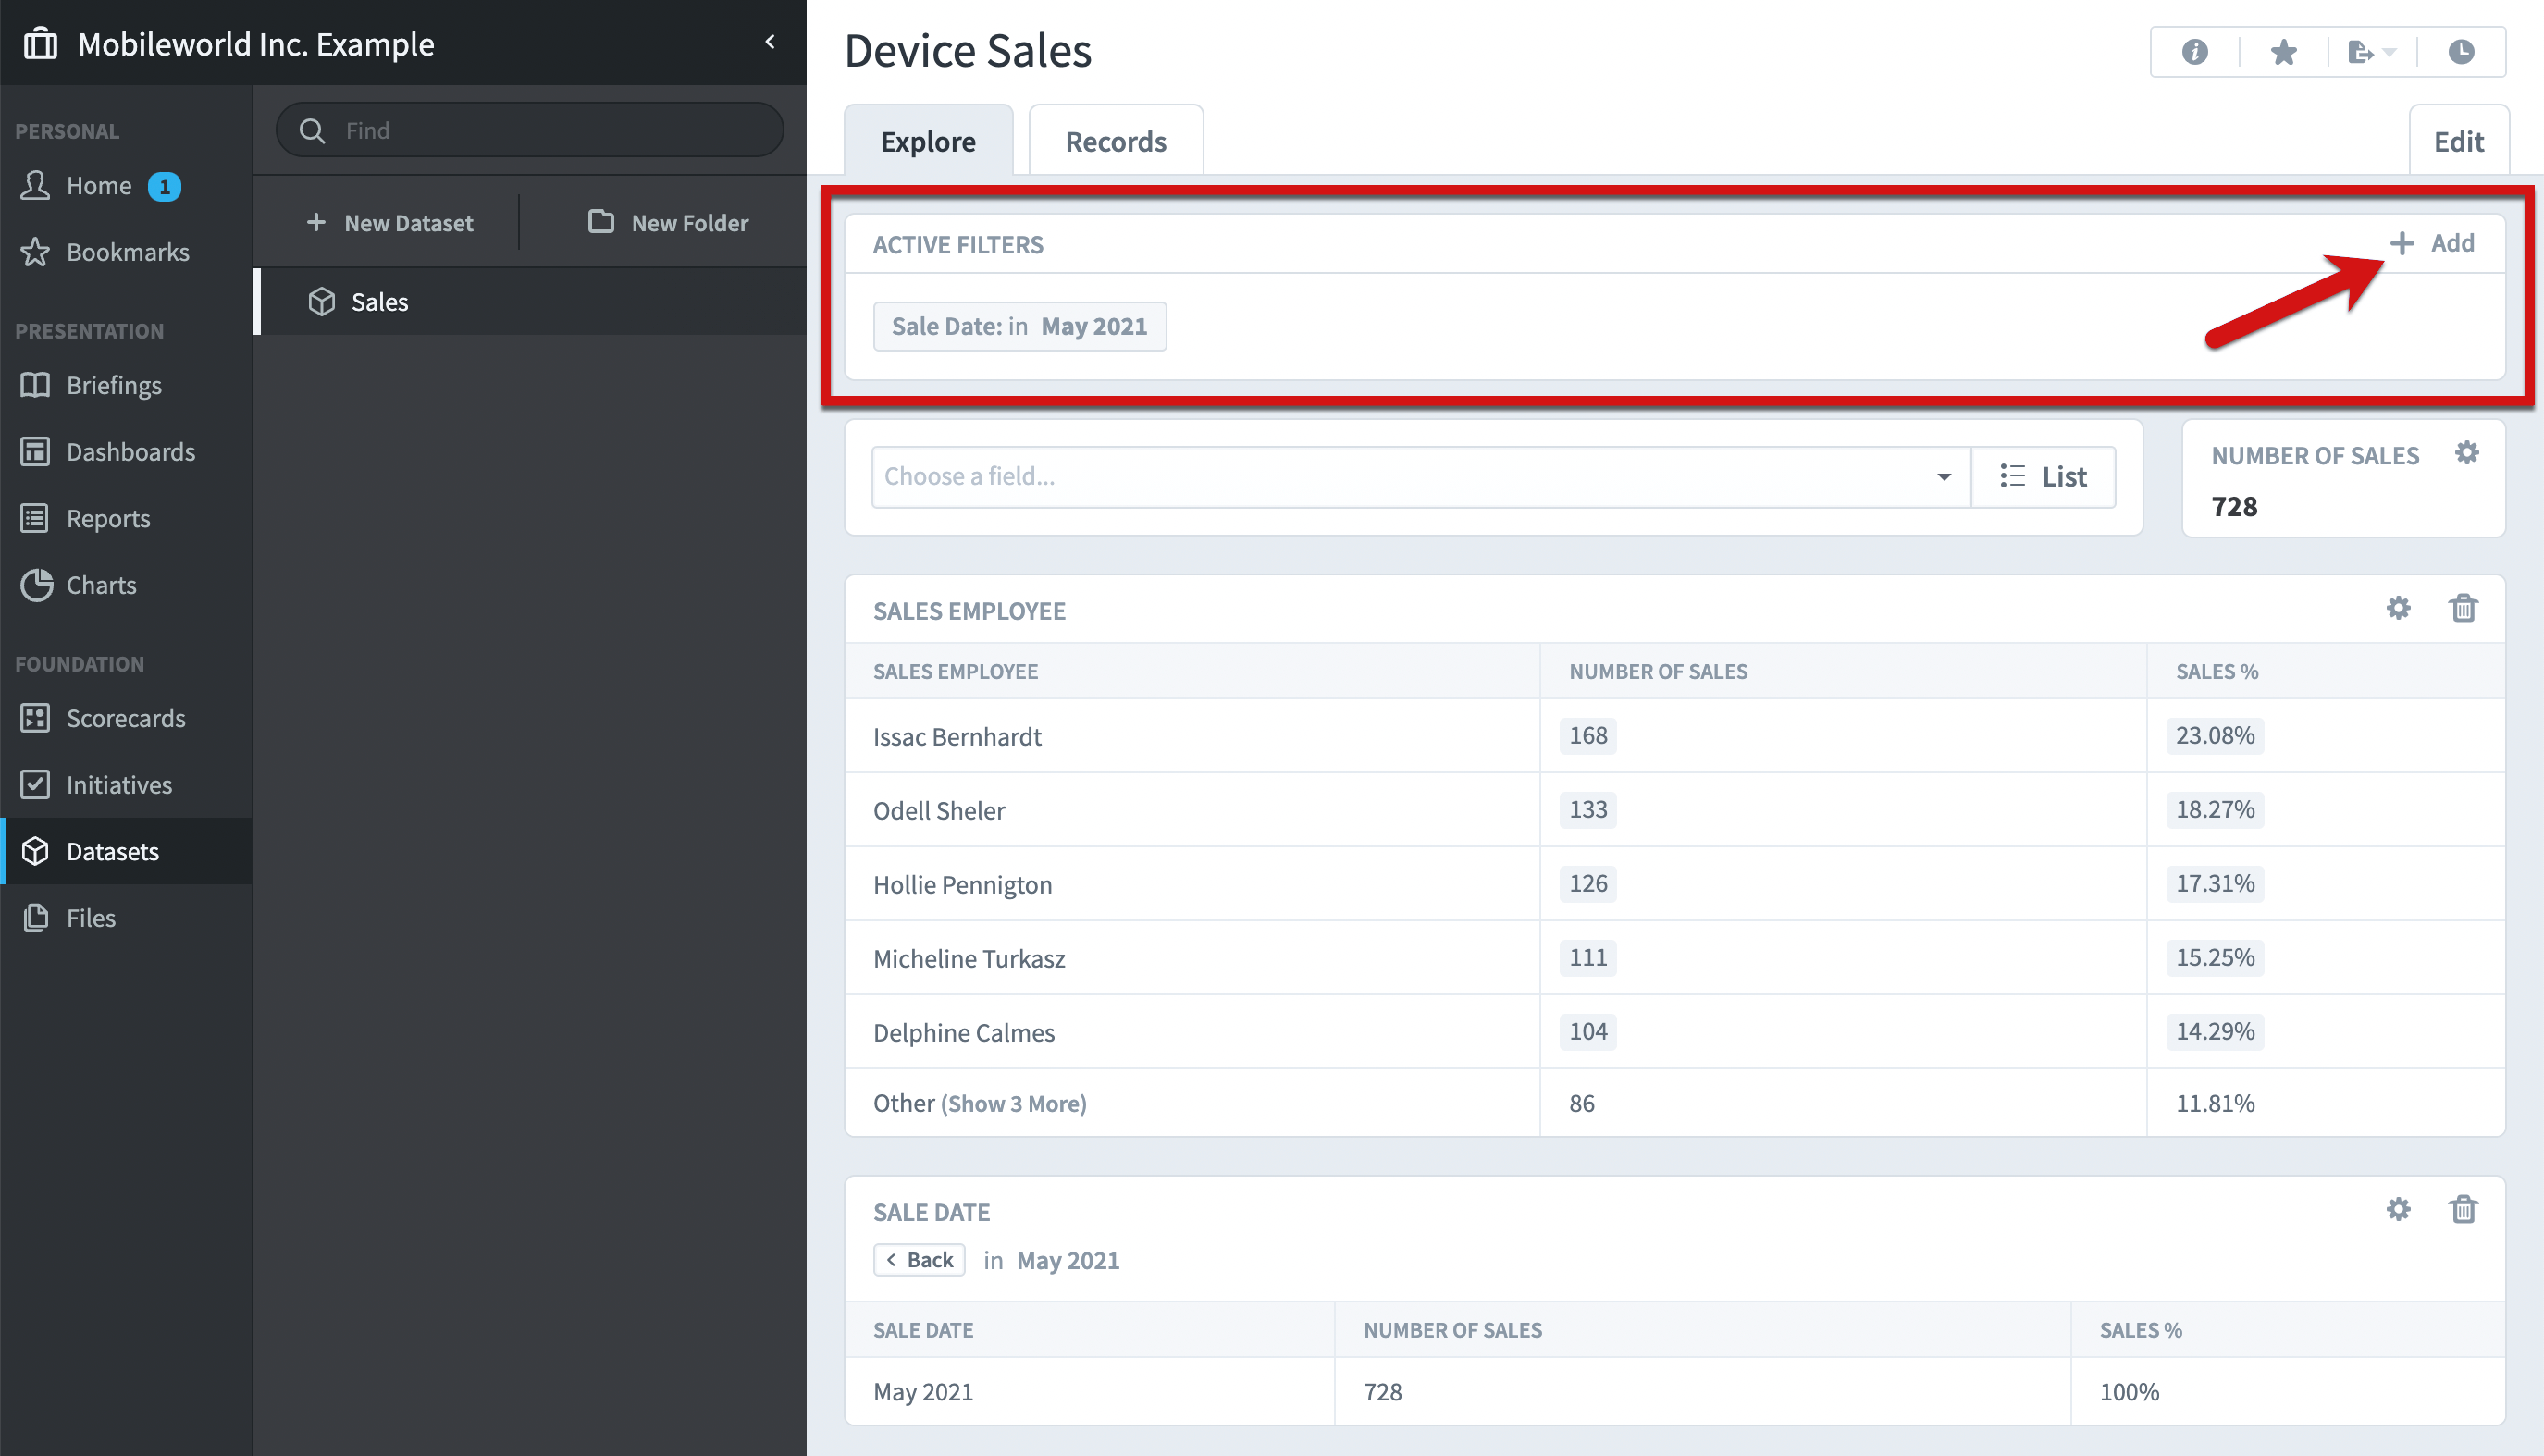
At the top of the Explore tab you can see all filters that are currently applied to the dataset. In this example we can see the “Sale Date = May 2021” filter that we applied by clicking on the “May 2021” row on the bottom. Another way to add a filter is to click on the “Add” button in the corner.
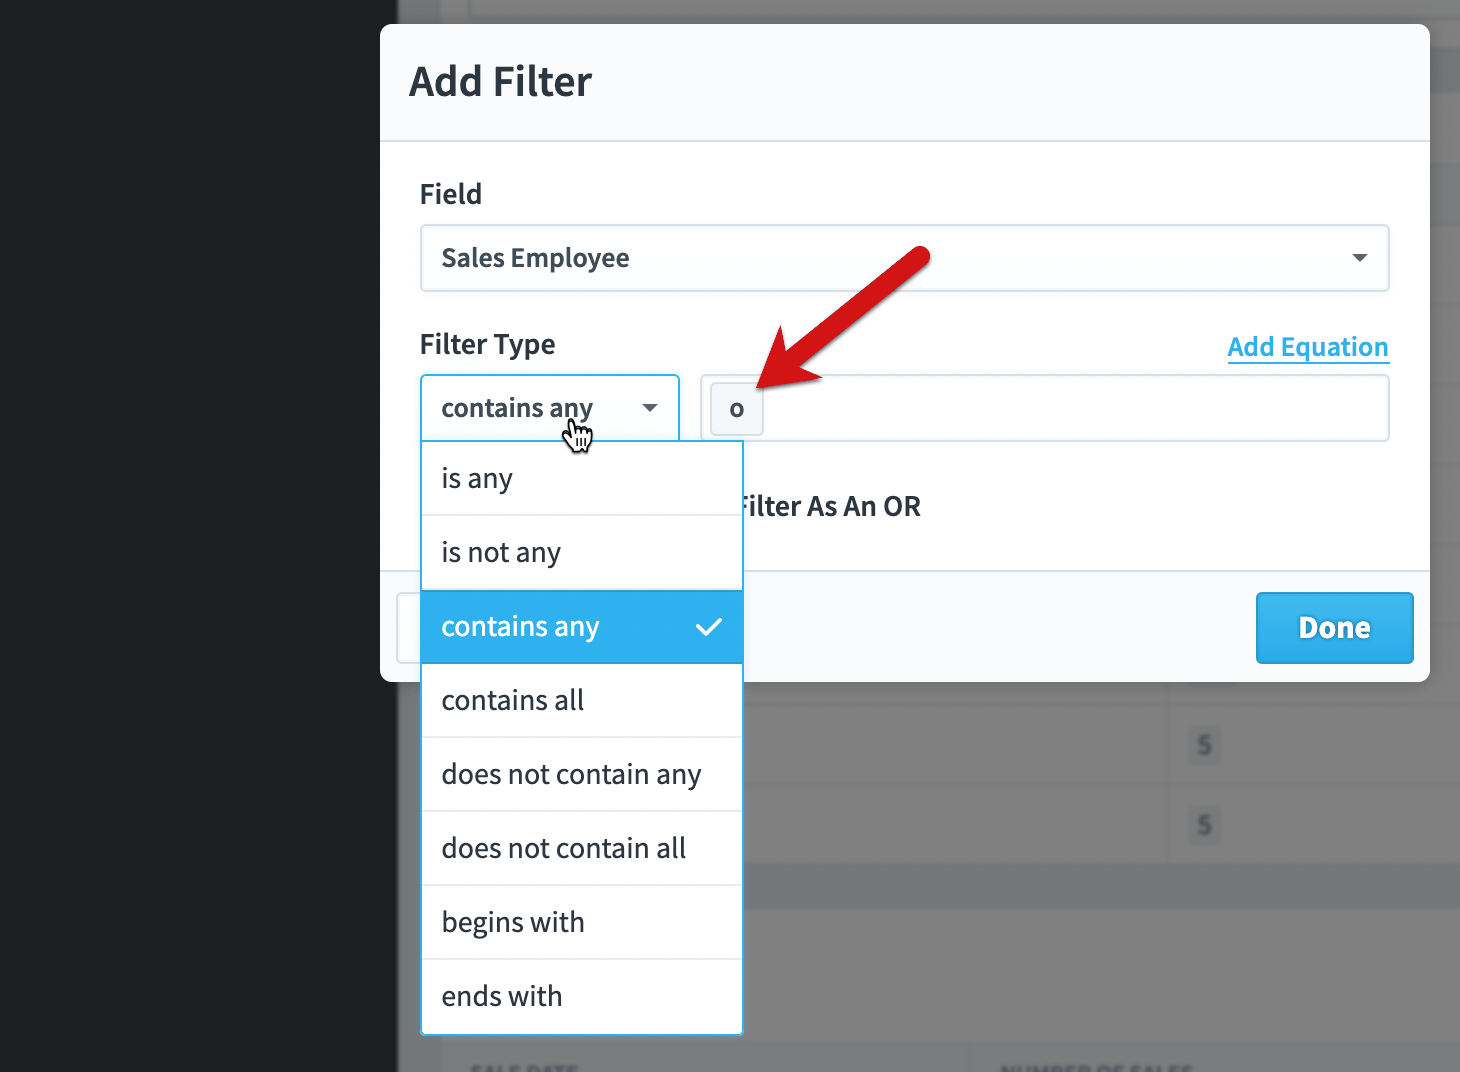
Just for the sale of this example we’ll only show sales employees that have an “O” in their names.
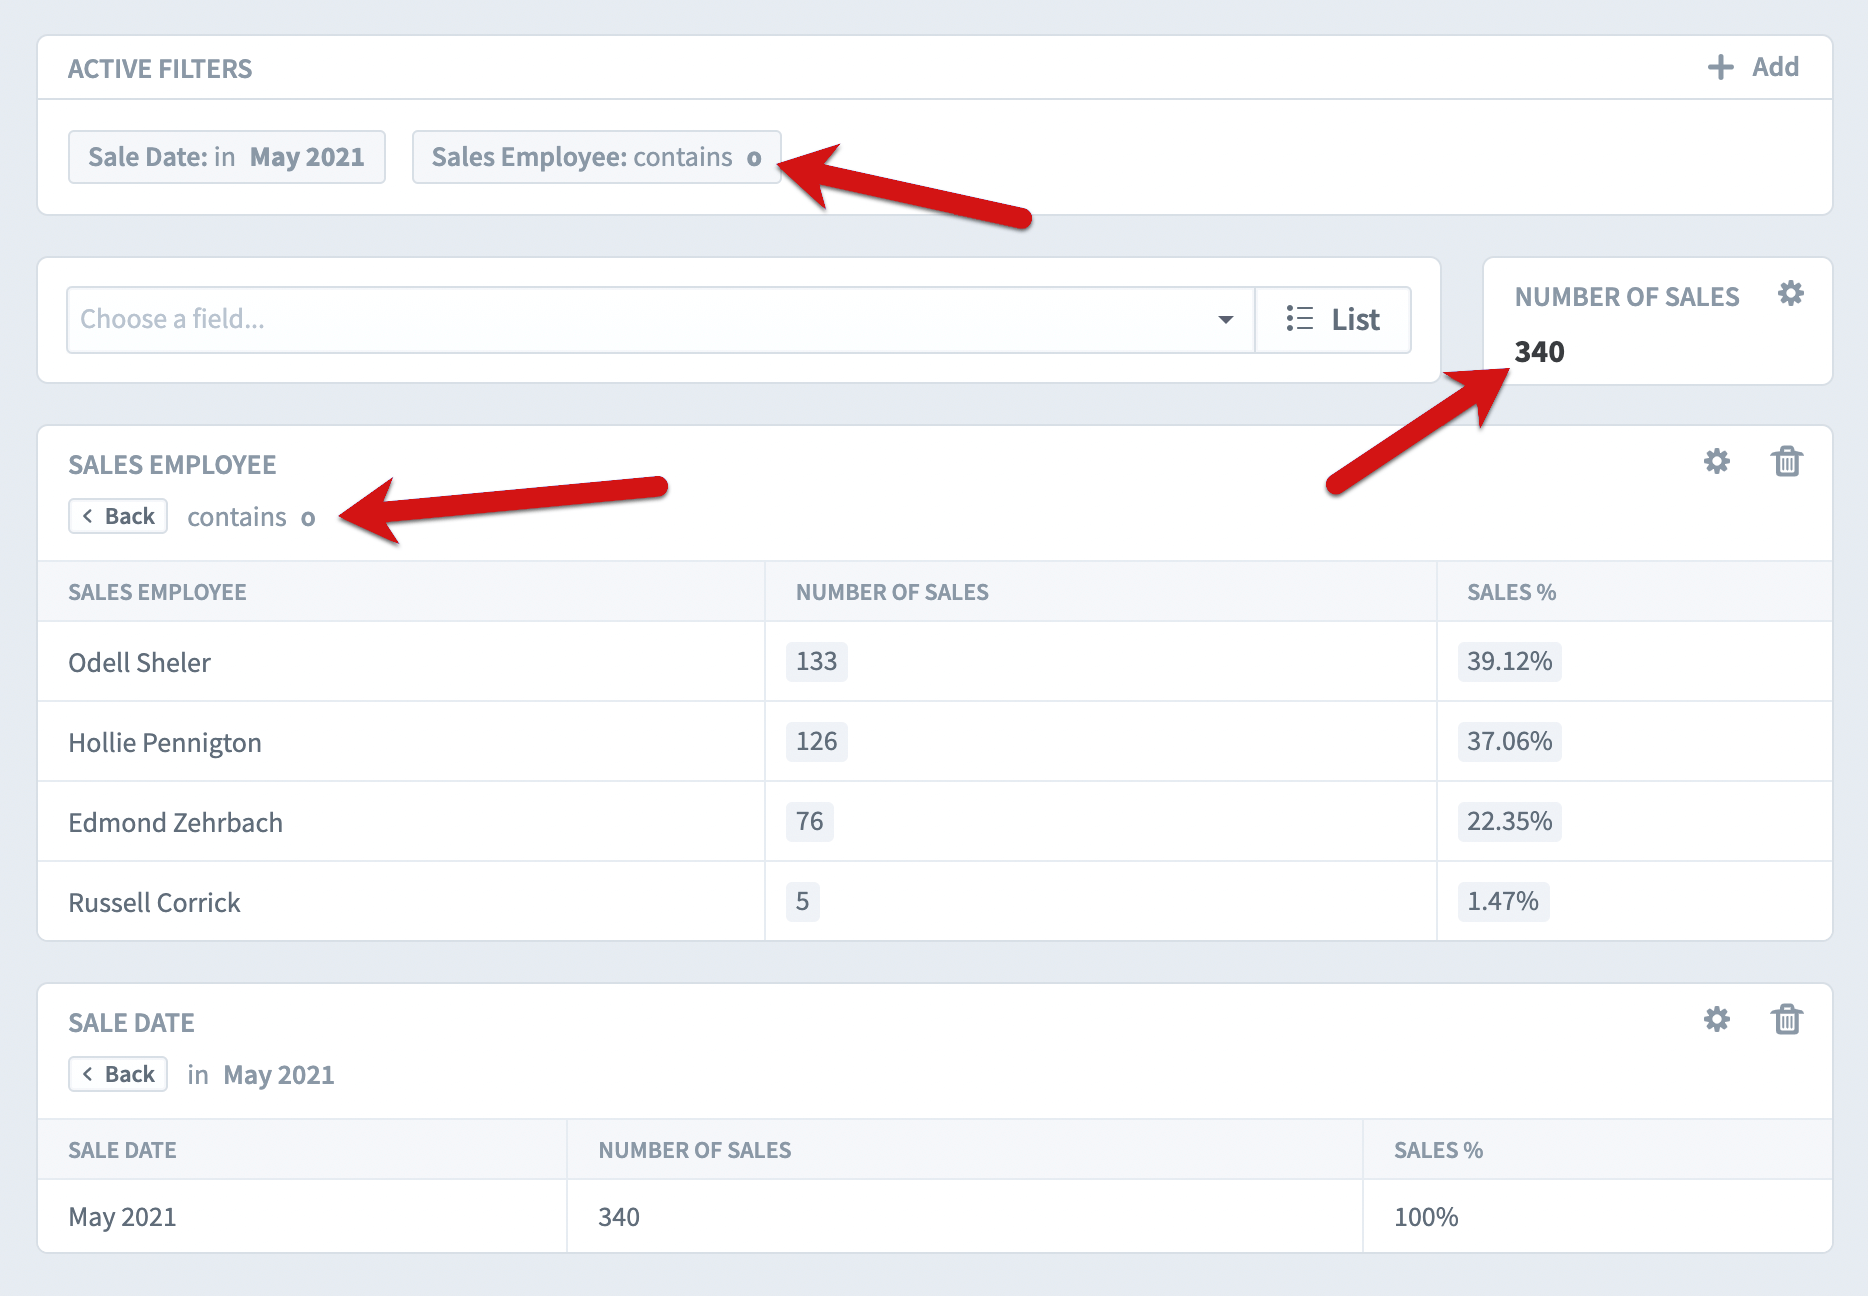
The results of the filter are the same as before, except now we’re only showing data for four of the sales reps.
Changing total display
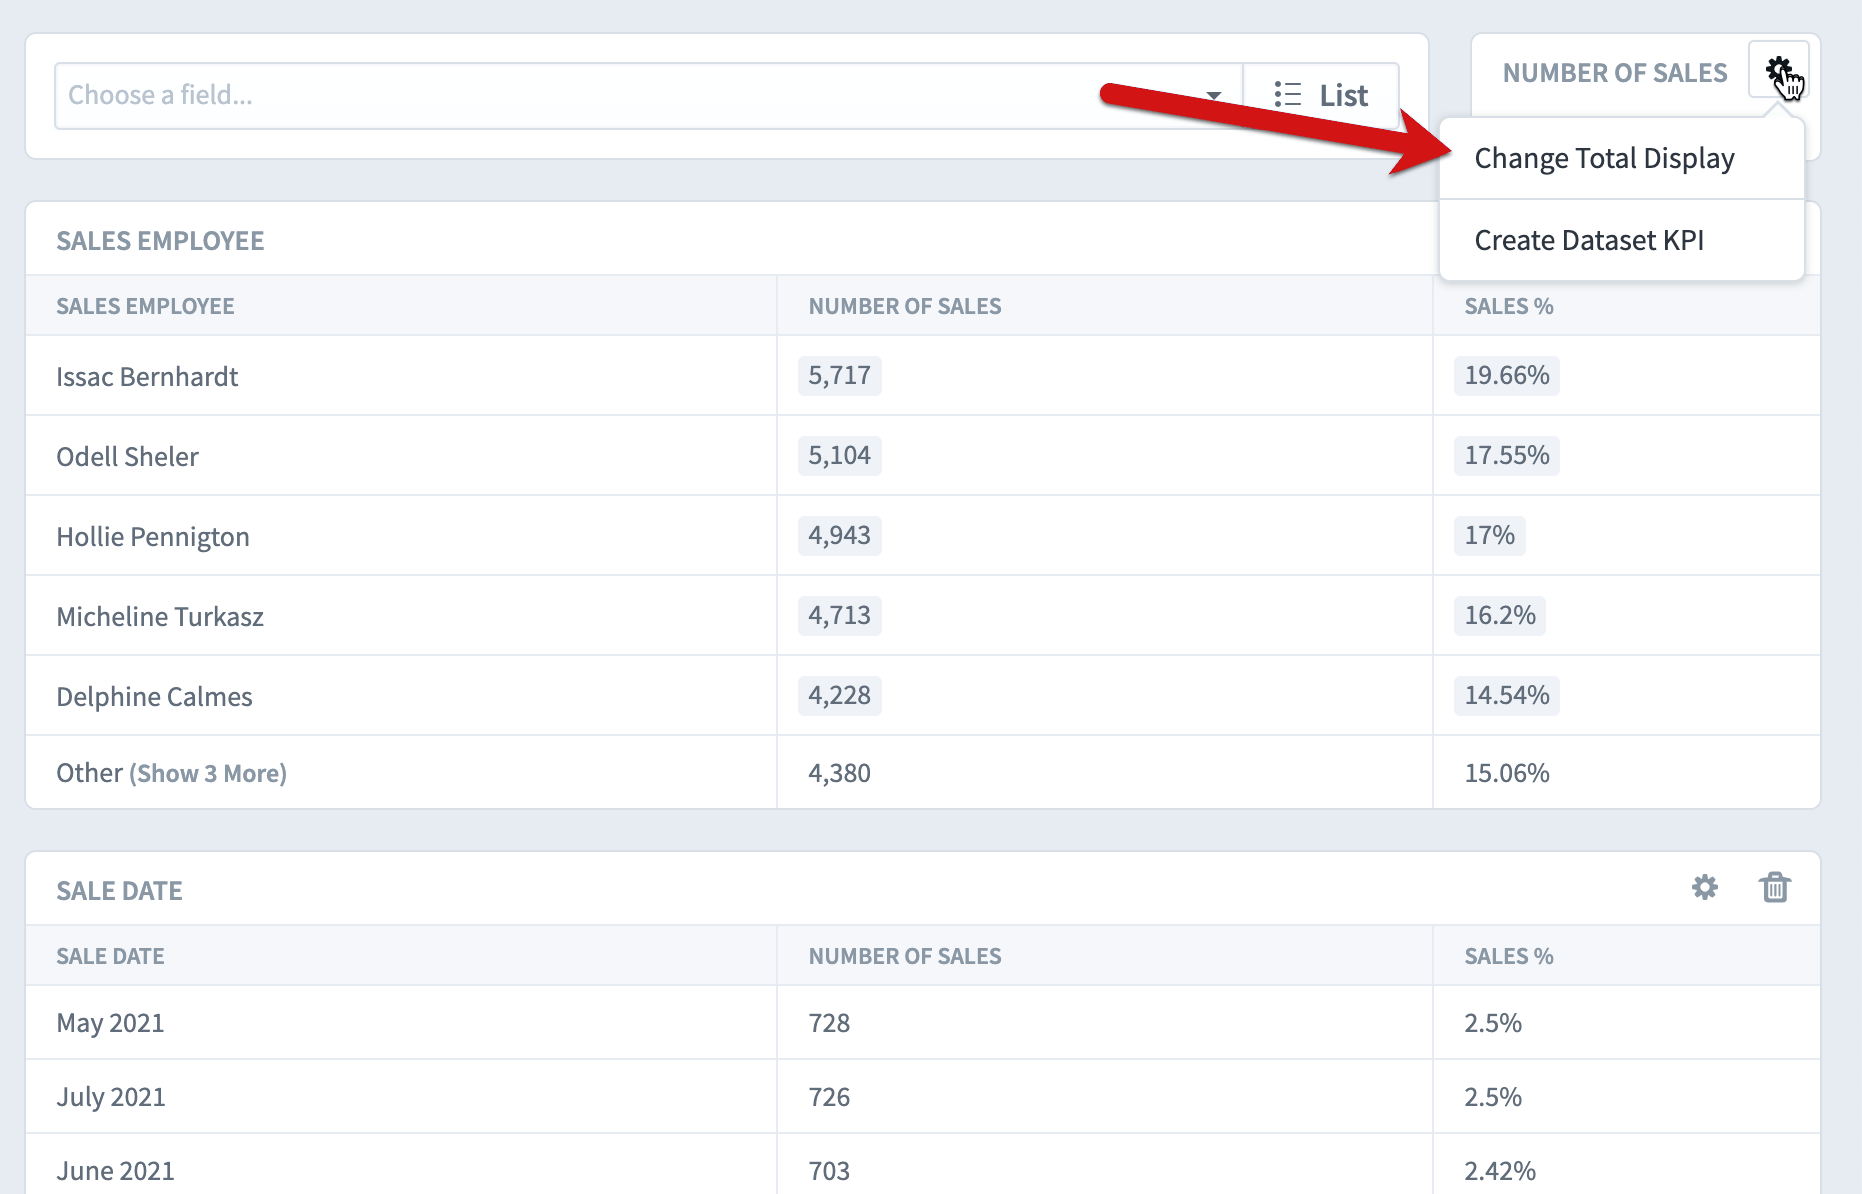
Seeing the total number of sales is interesting, but what we probably care the most about is the total value if the sales. The quickest way is to change the total display in the upper right corner.
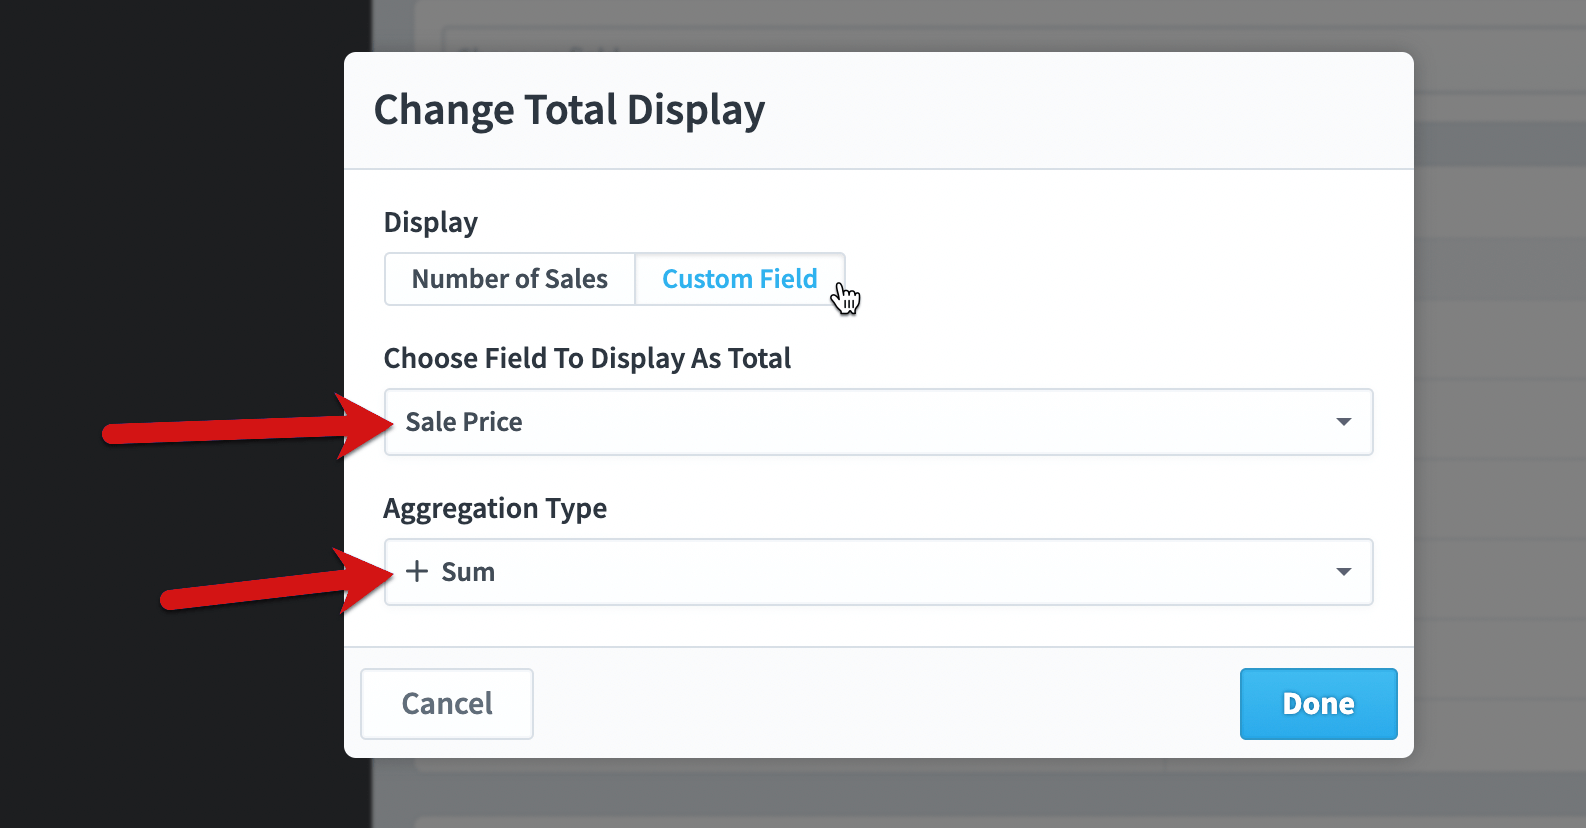
We’ll change the display from “Number of Sales” to “Custom Field”, choose “Sale Price” as the field we want to see, and “Sum” for the aggregation type.
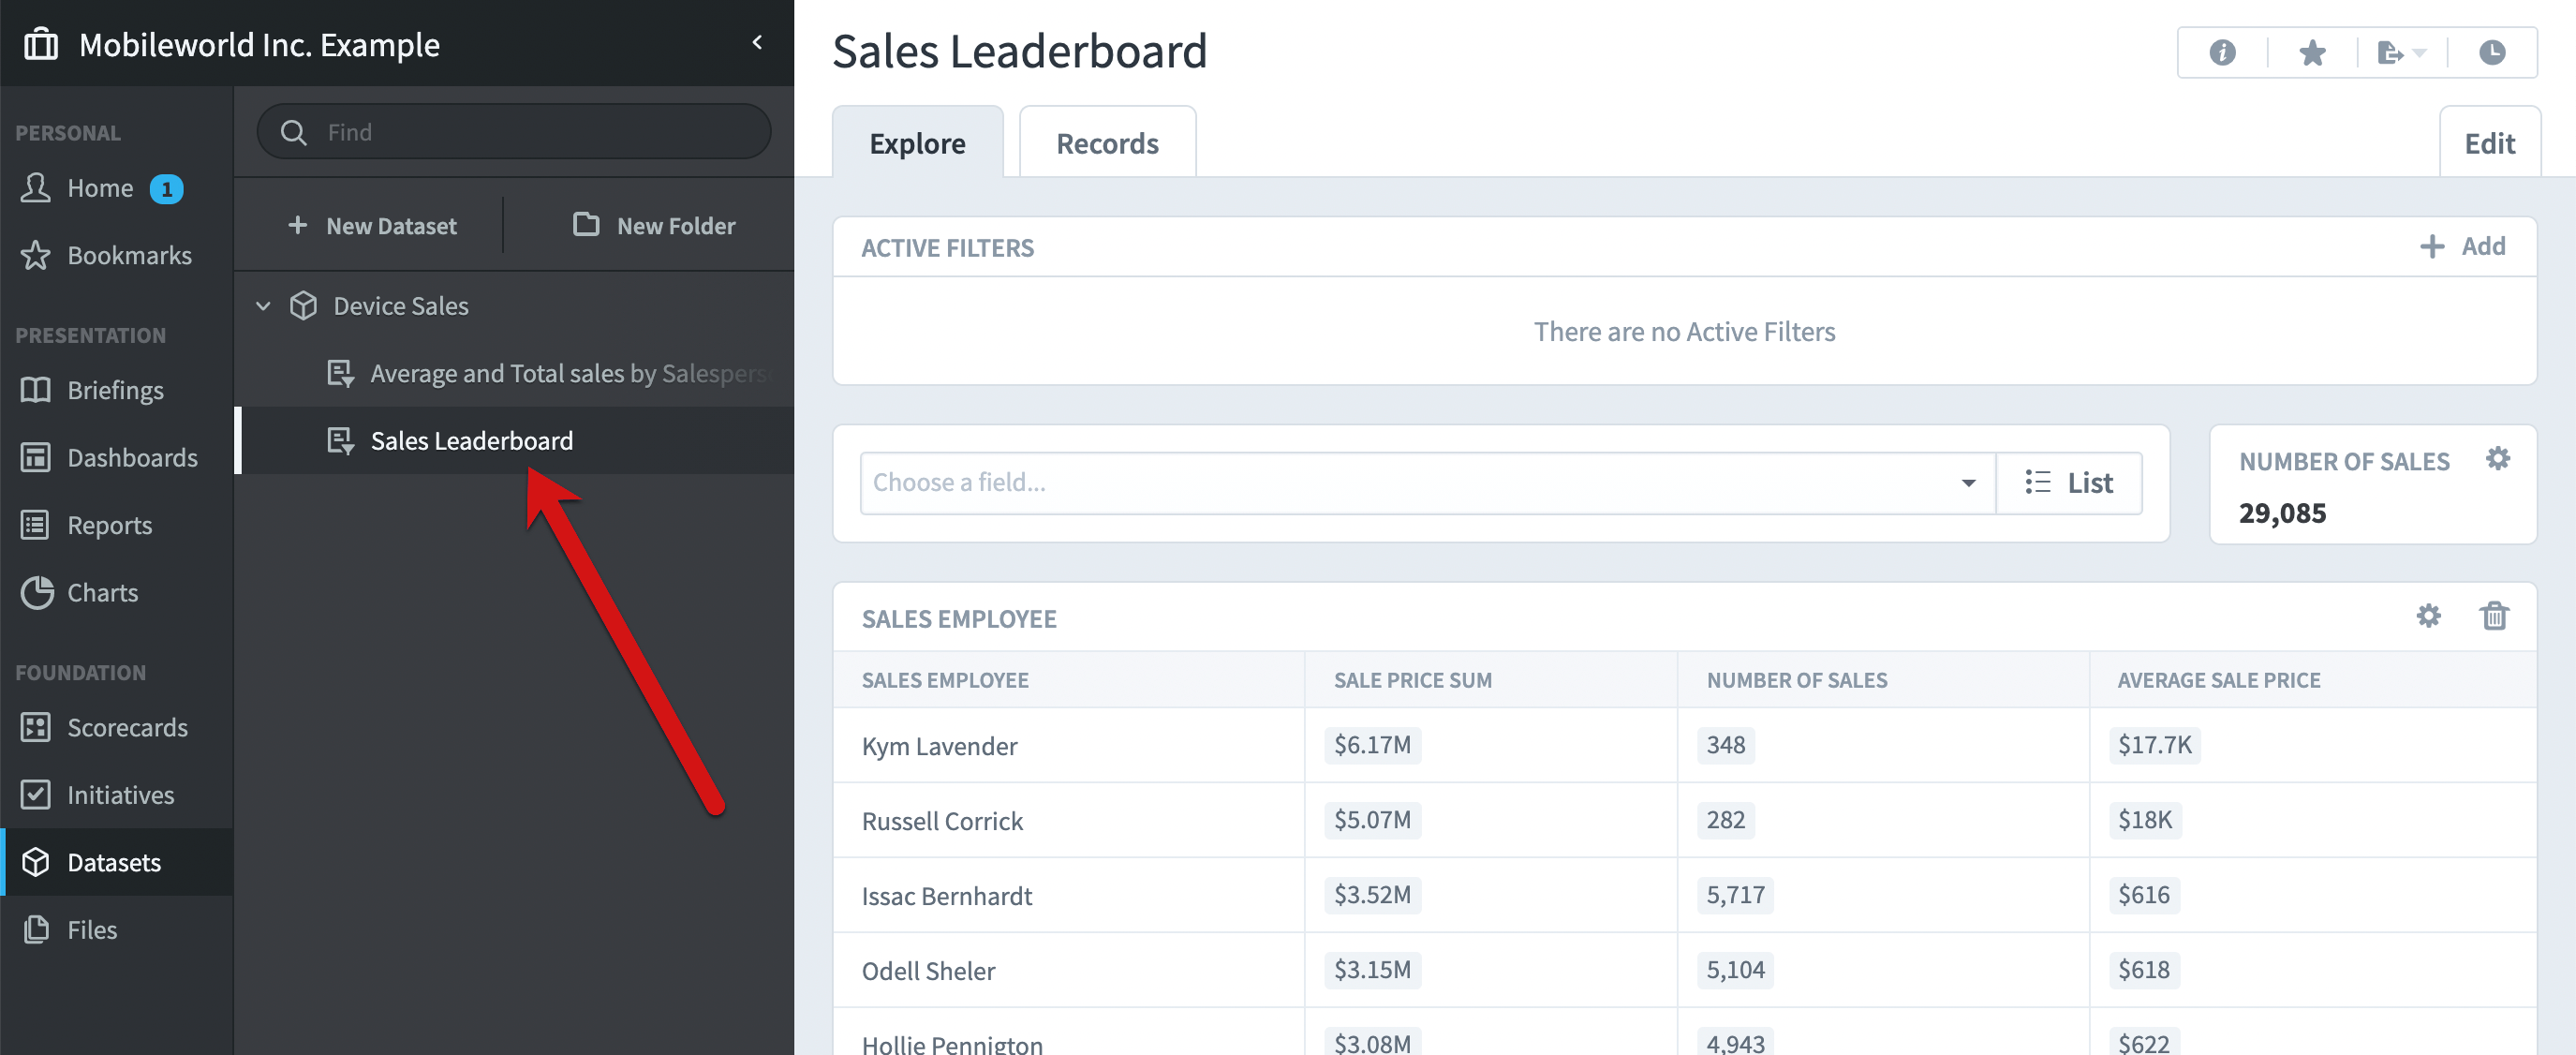
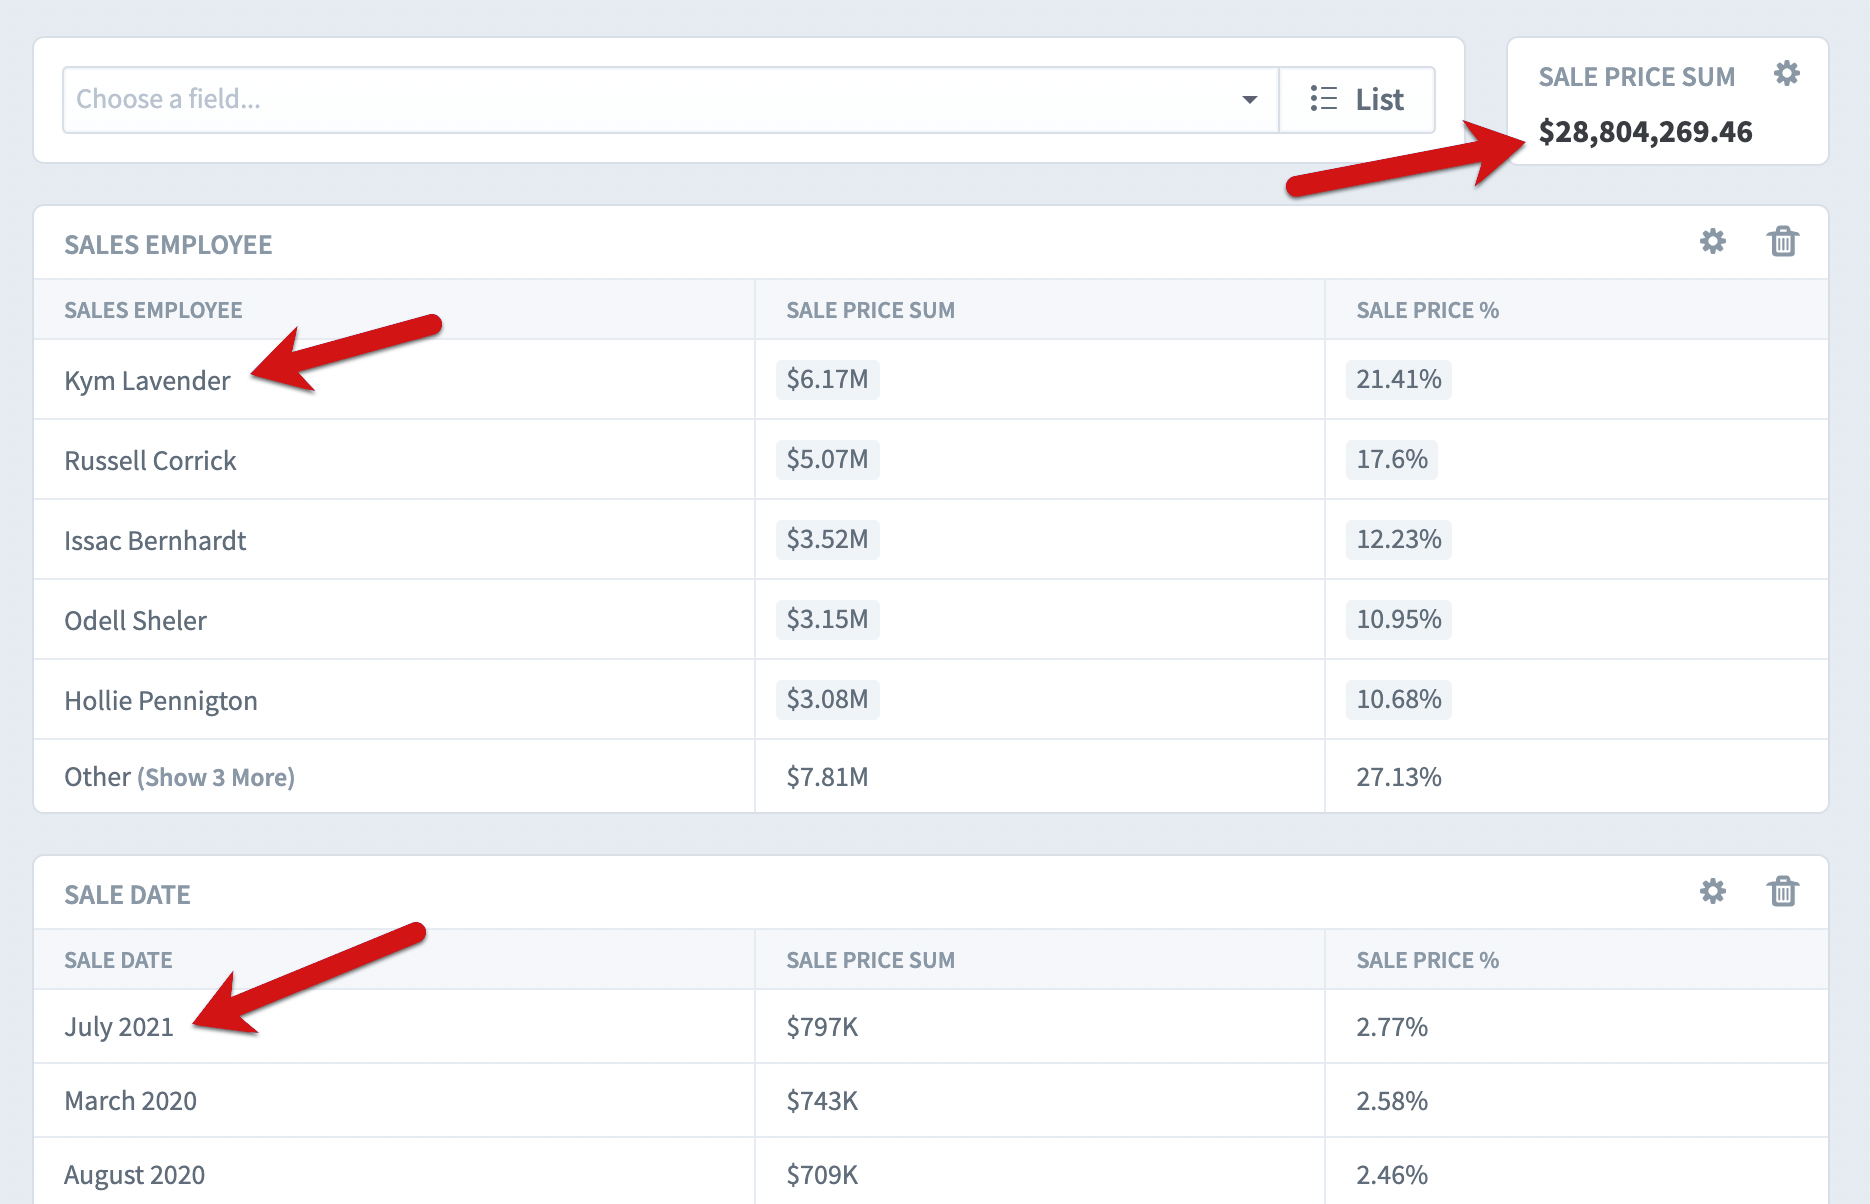
The sales price tells a completely different story. We now see that Kym Lavender is our top salesperson with $6.1M in total sales, and that July 2021 was actually our top sales month by revenue.
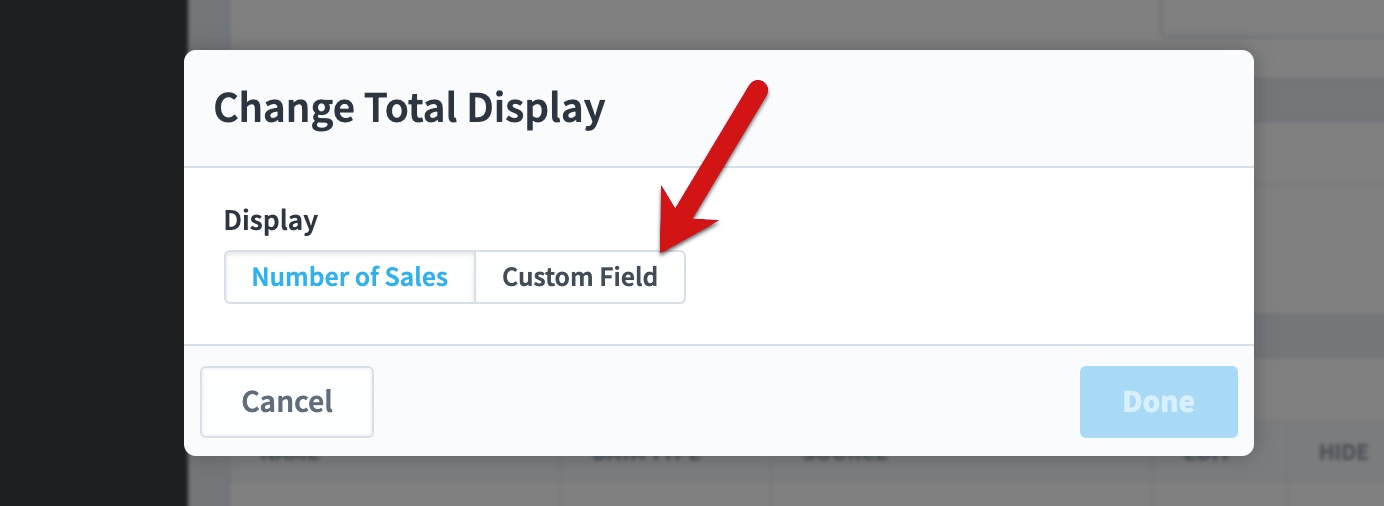
In this example, sale price is obviously better than the number of sales, so we’re going to go to the Edit tab and change the “Defaults for Total Display”.

We can make the change from “Number of Sales” to “Custom Field” so that next time someone explores the Device Sales dataset it will default to showing Sales Price.
Choosing columns
Another way to change the data being displayed is to manually choose a table’s columns.
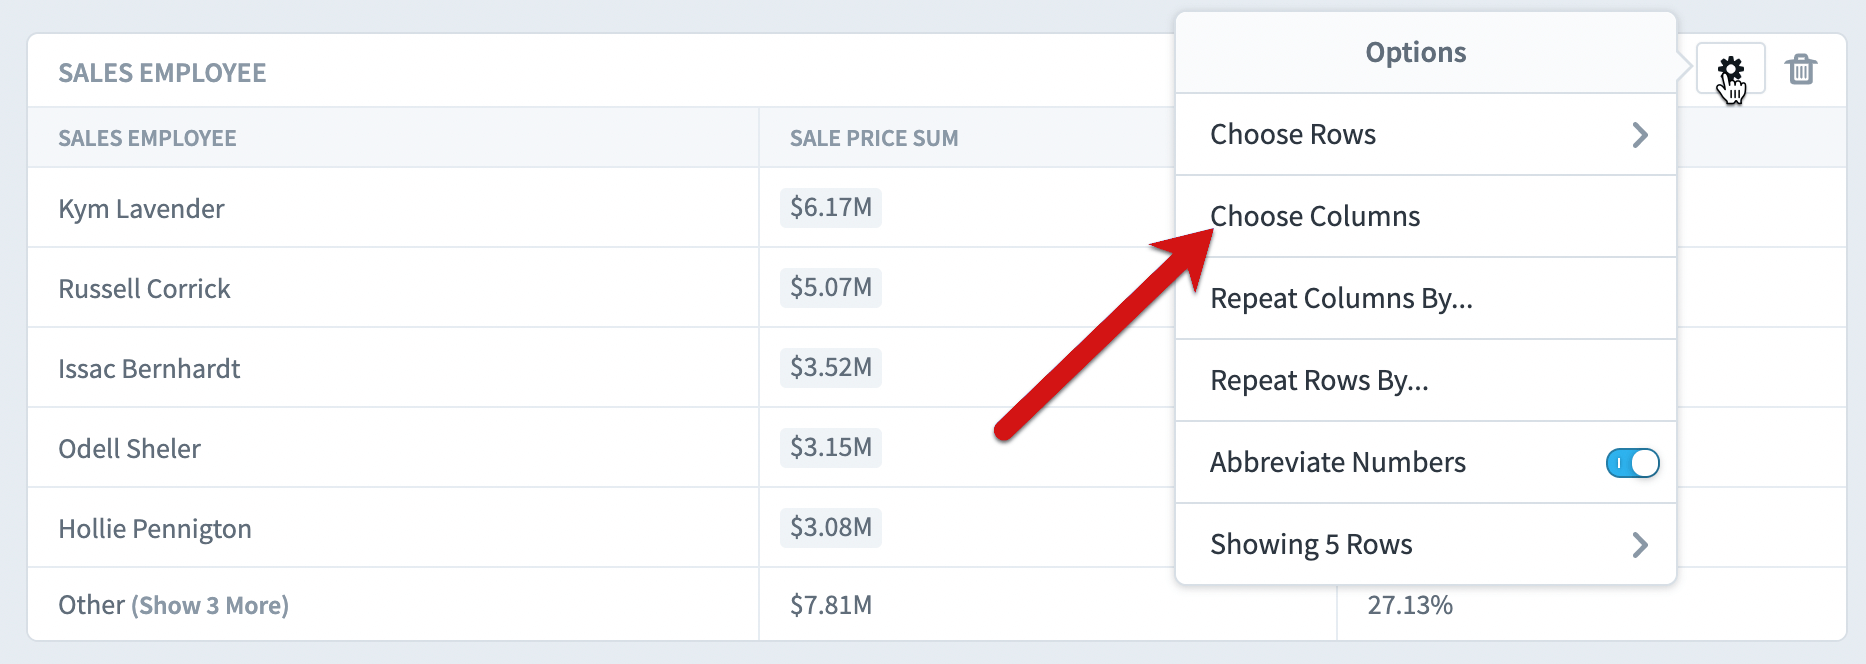
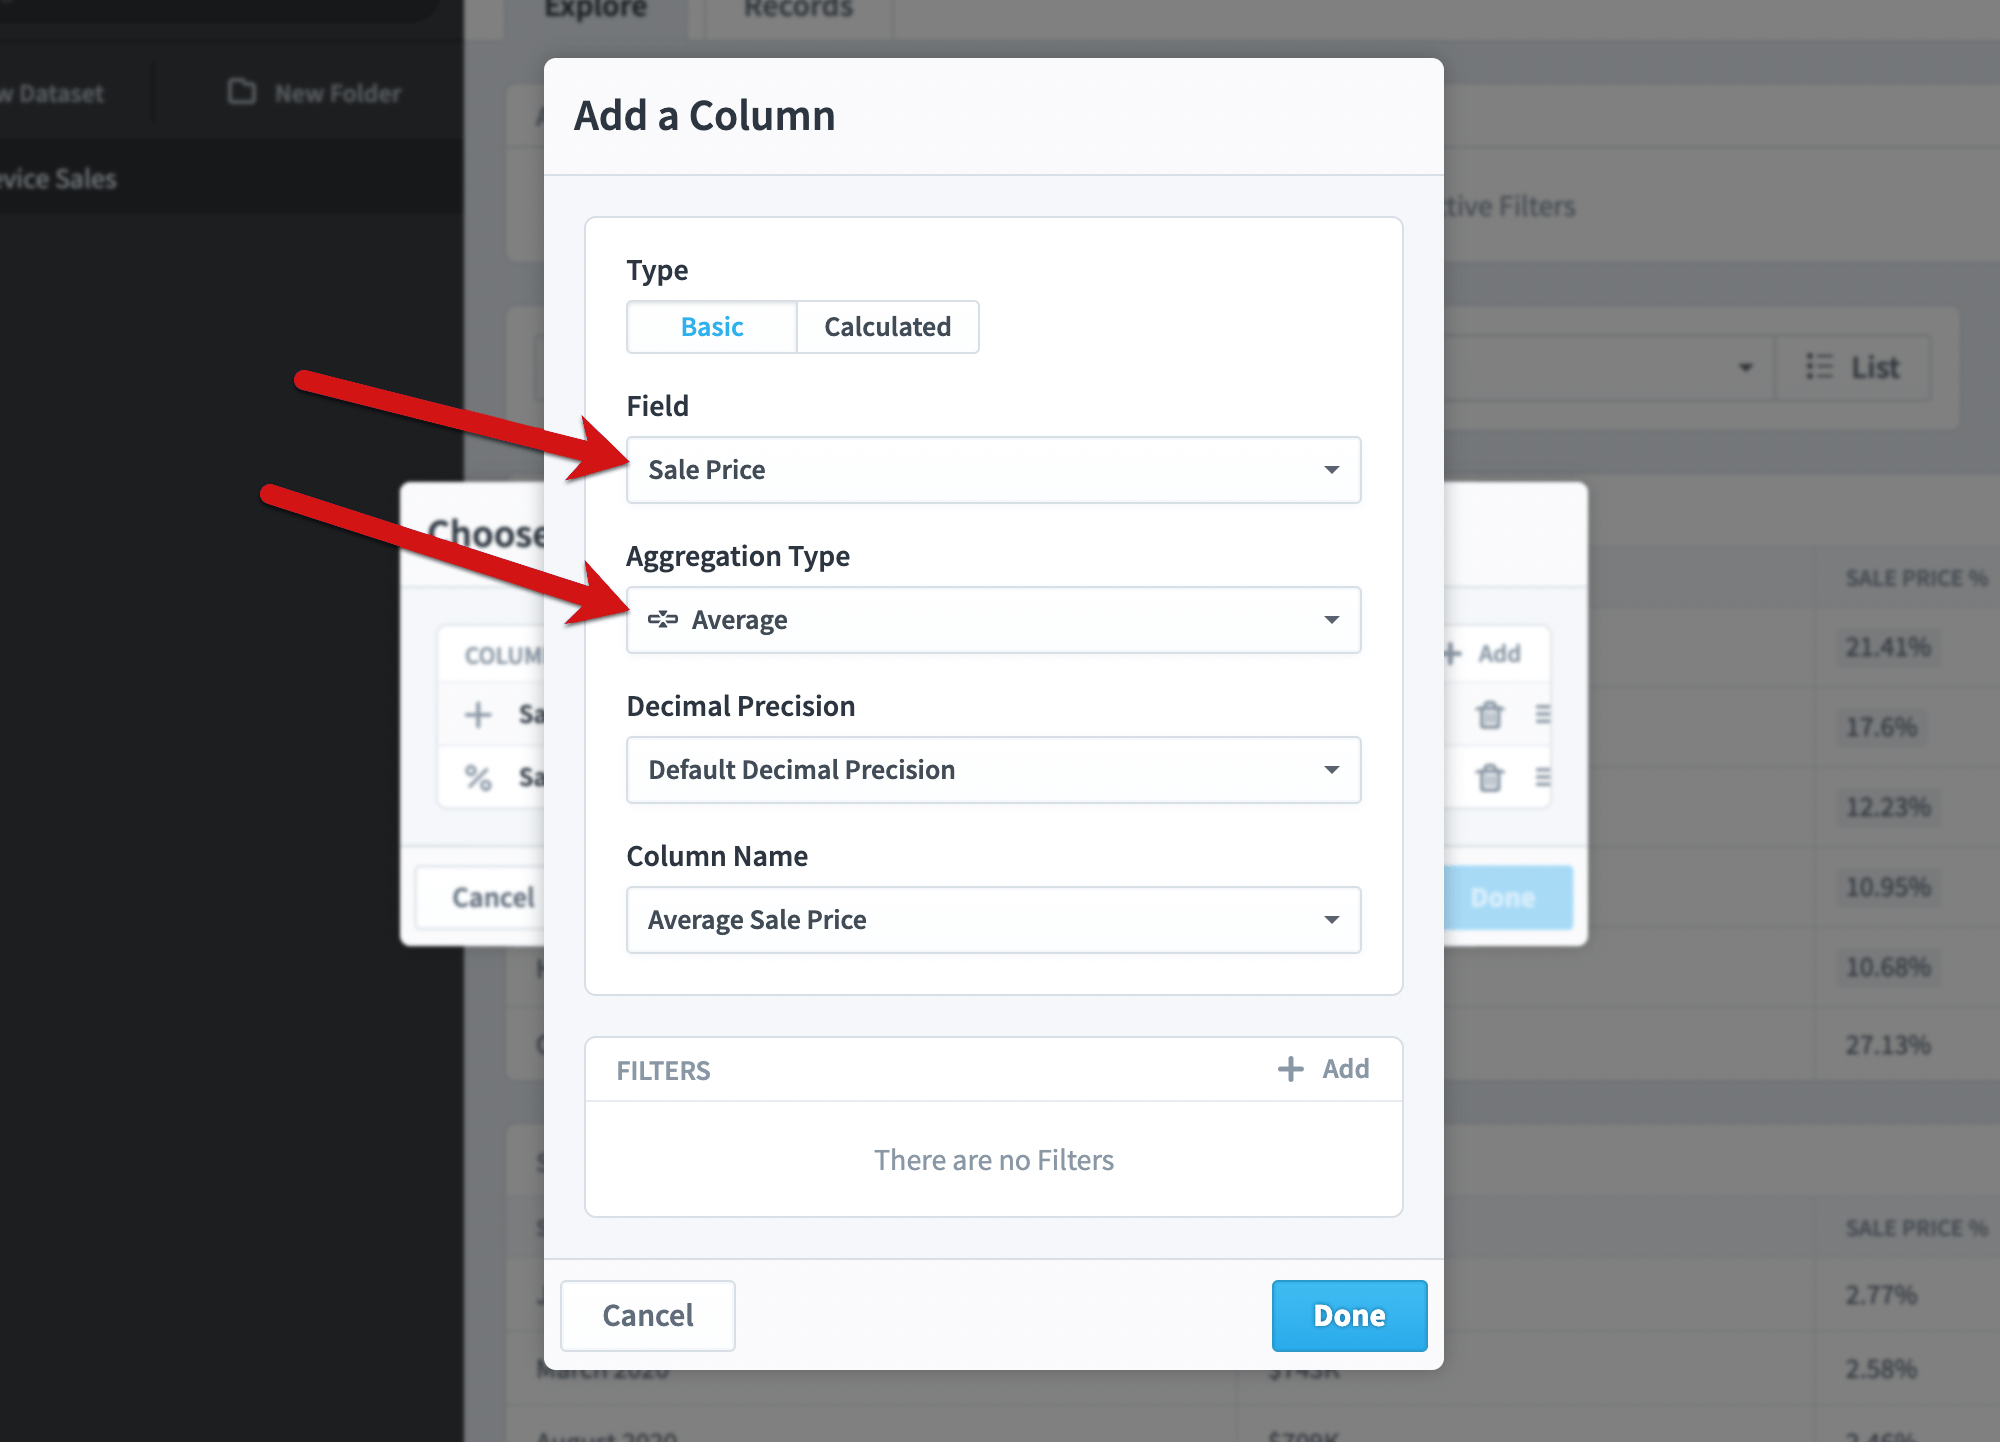
We’re going to add an Average Sale Price column to the Sales Employee table to figure out why our employee rankings changed so much when we switched from number of sales to total sales value.
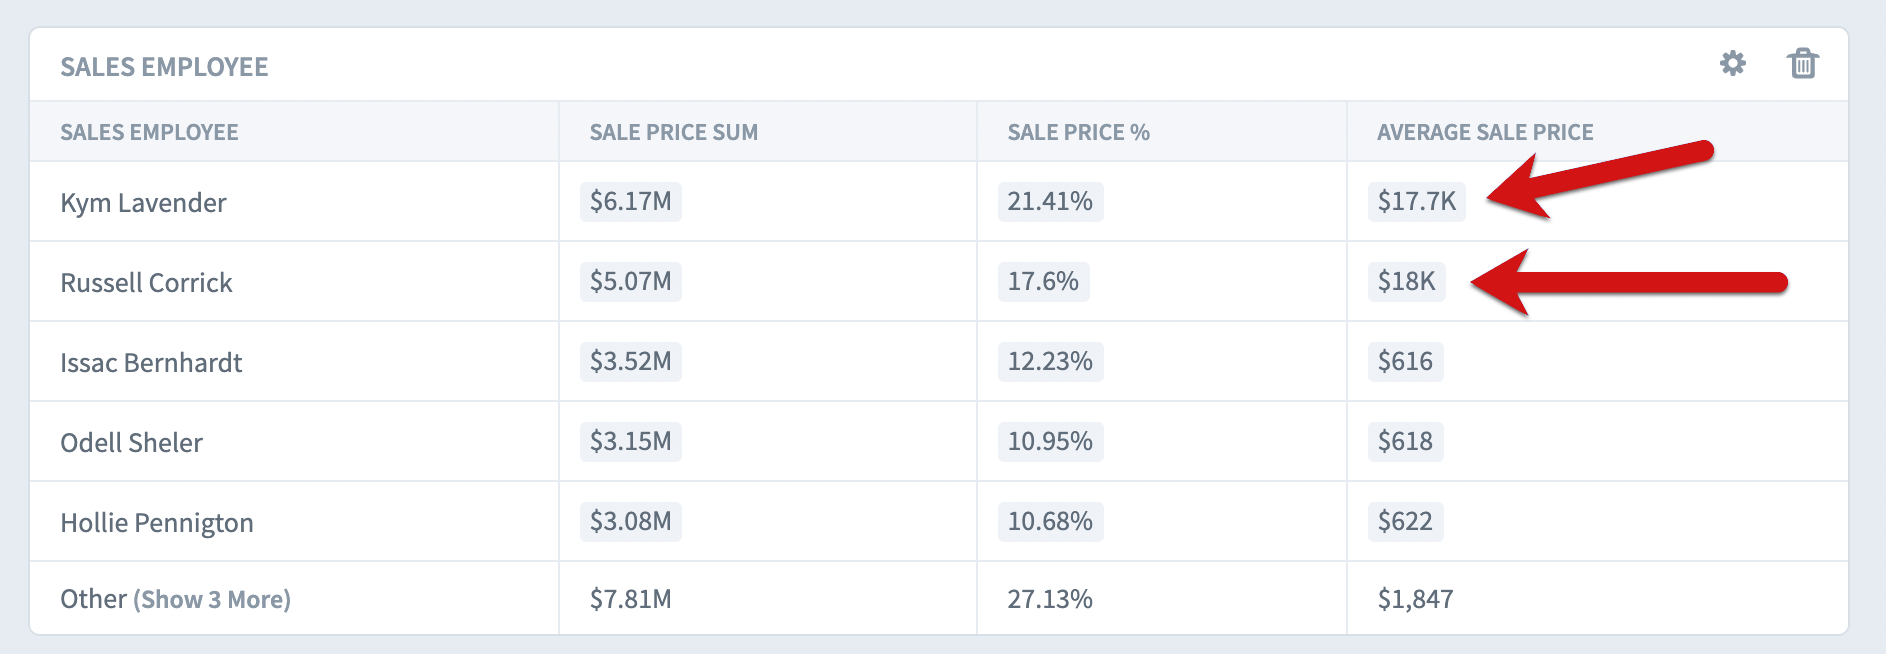
Sure enough, Kym and Russel had average sales around $18,000 while everyone else was averaging less than $700.
Repeating rows and columns
Here’s a simple table showing the sum and average sales price by month.

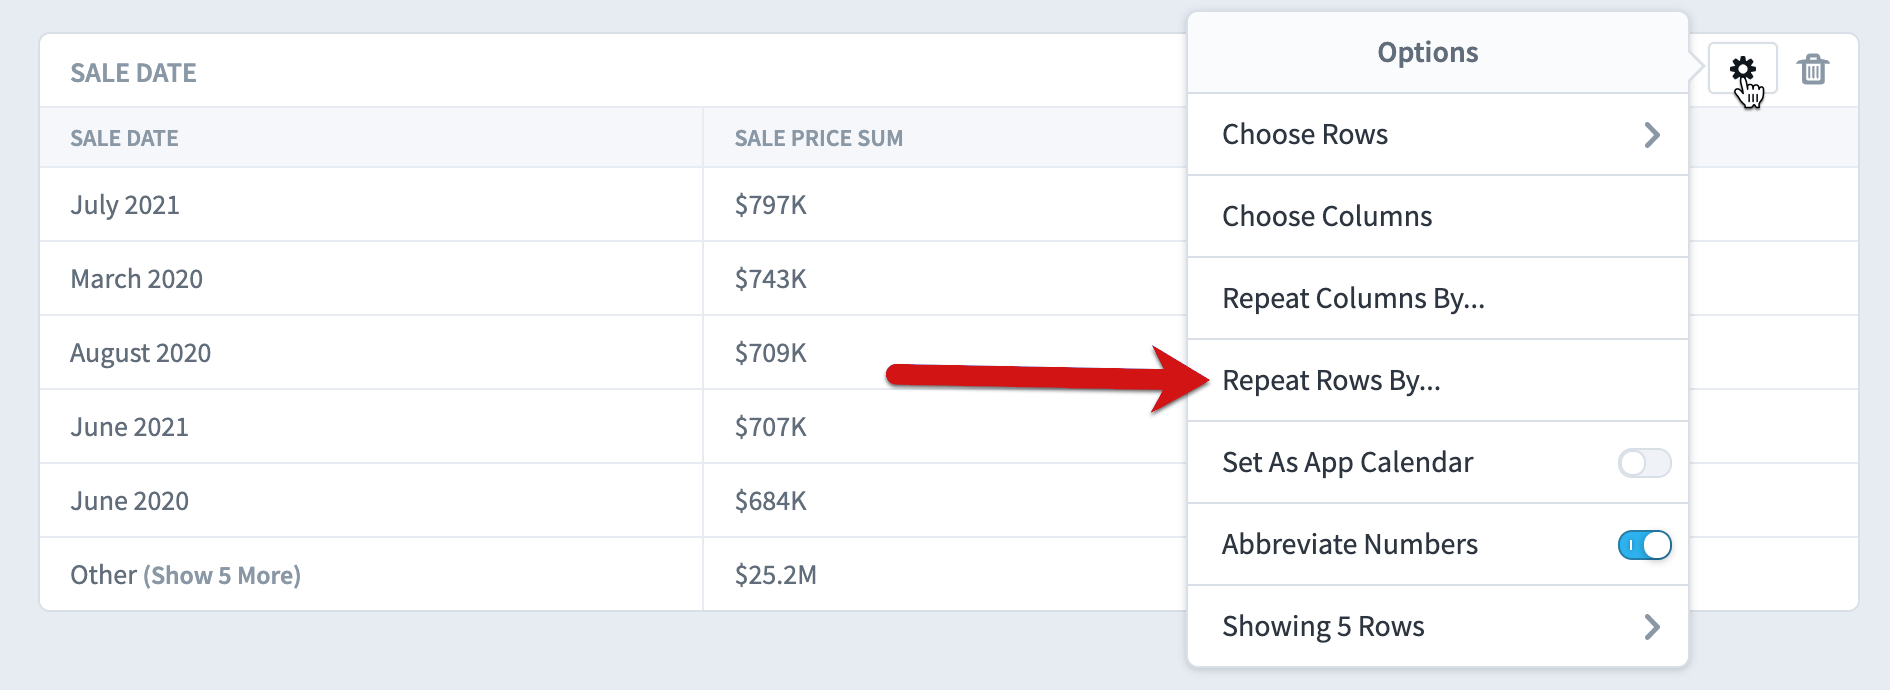
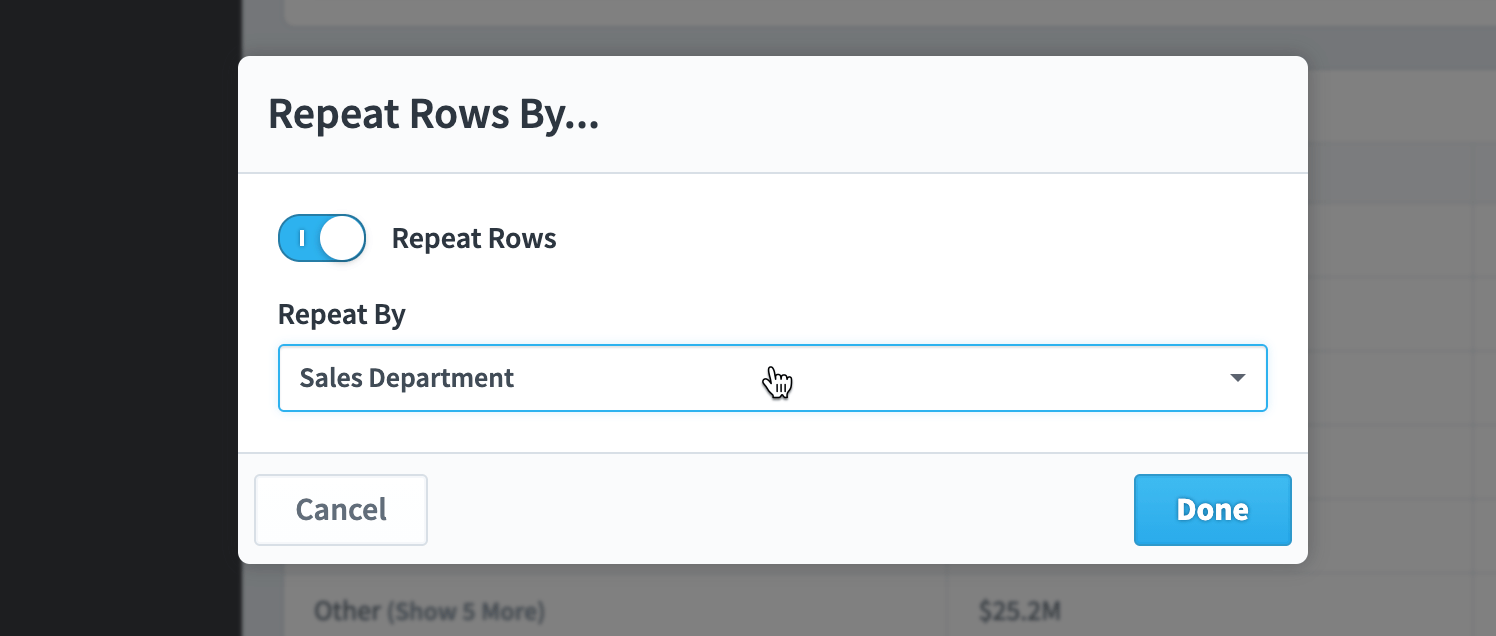
We want to see those numbers by sales department, however, so we’ll choose “Repeat Rows By…” from the options menu.
And we’ll choose the Sales Department field.
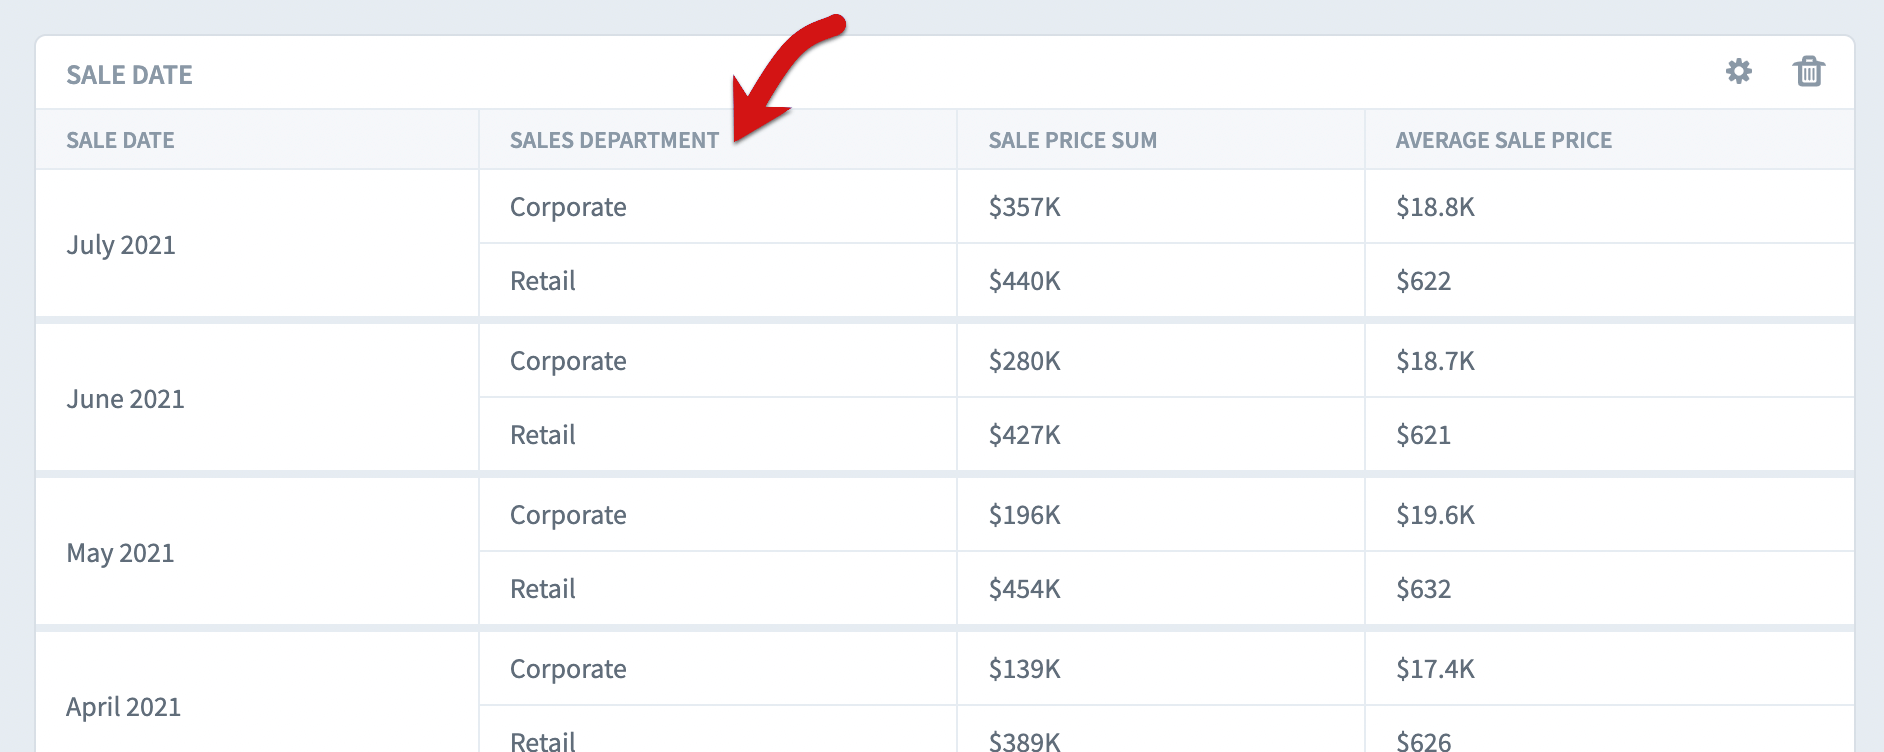
We can now see the sum and average sale price for each of our two sales departments for every month.
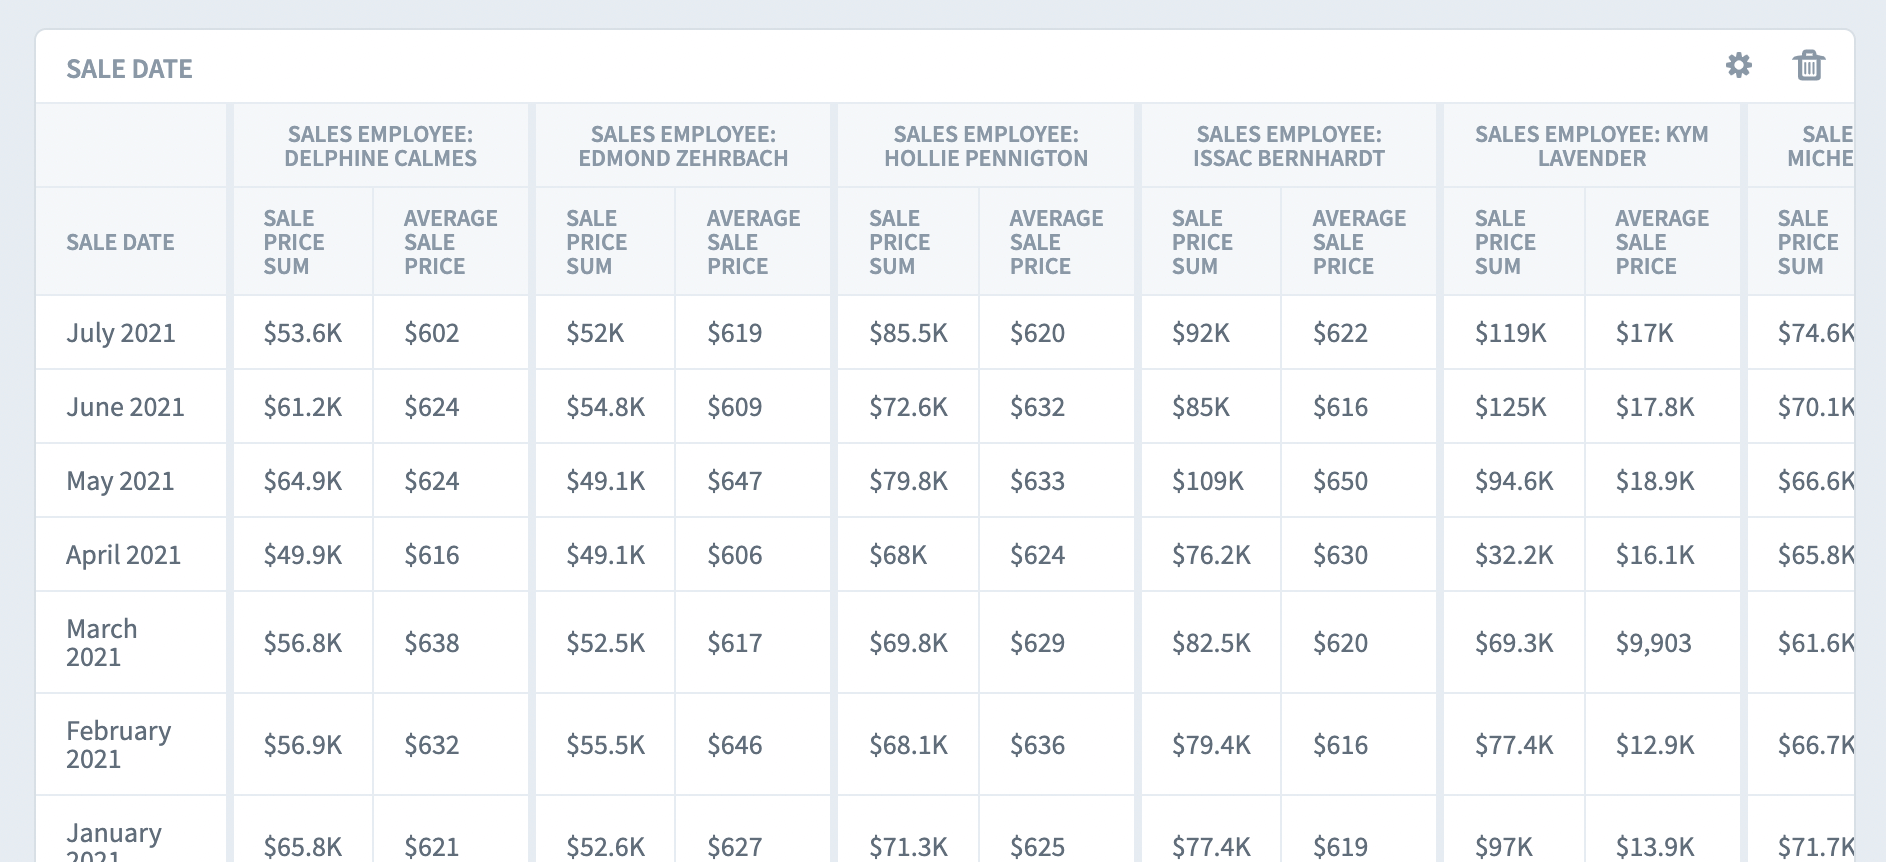
Similarly, you can also choose “Repeat Columns By…” In this example we’re repeating the sum and average sales columns by salesperson.
Saving views
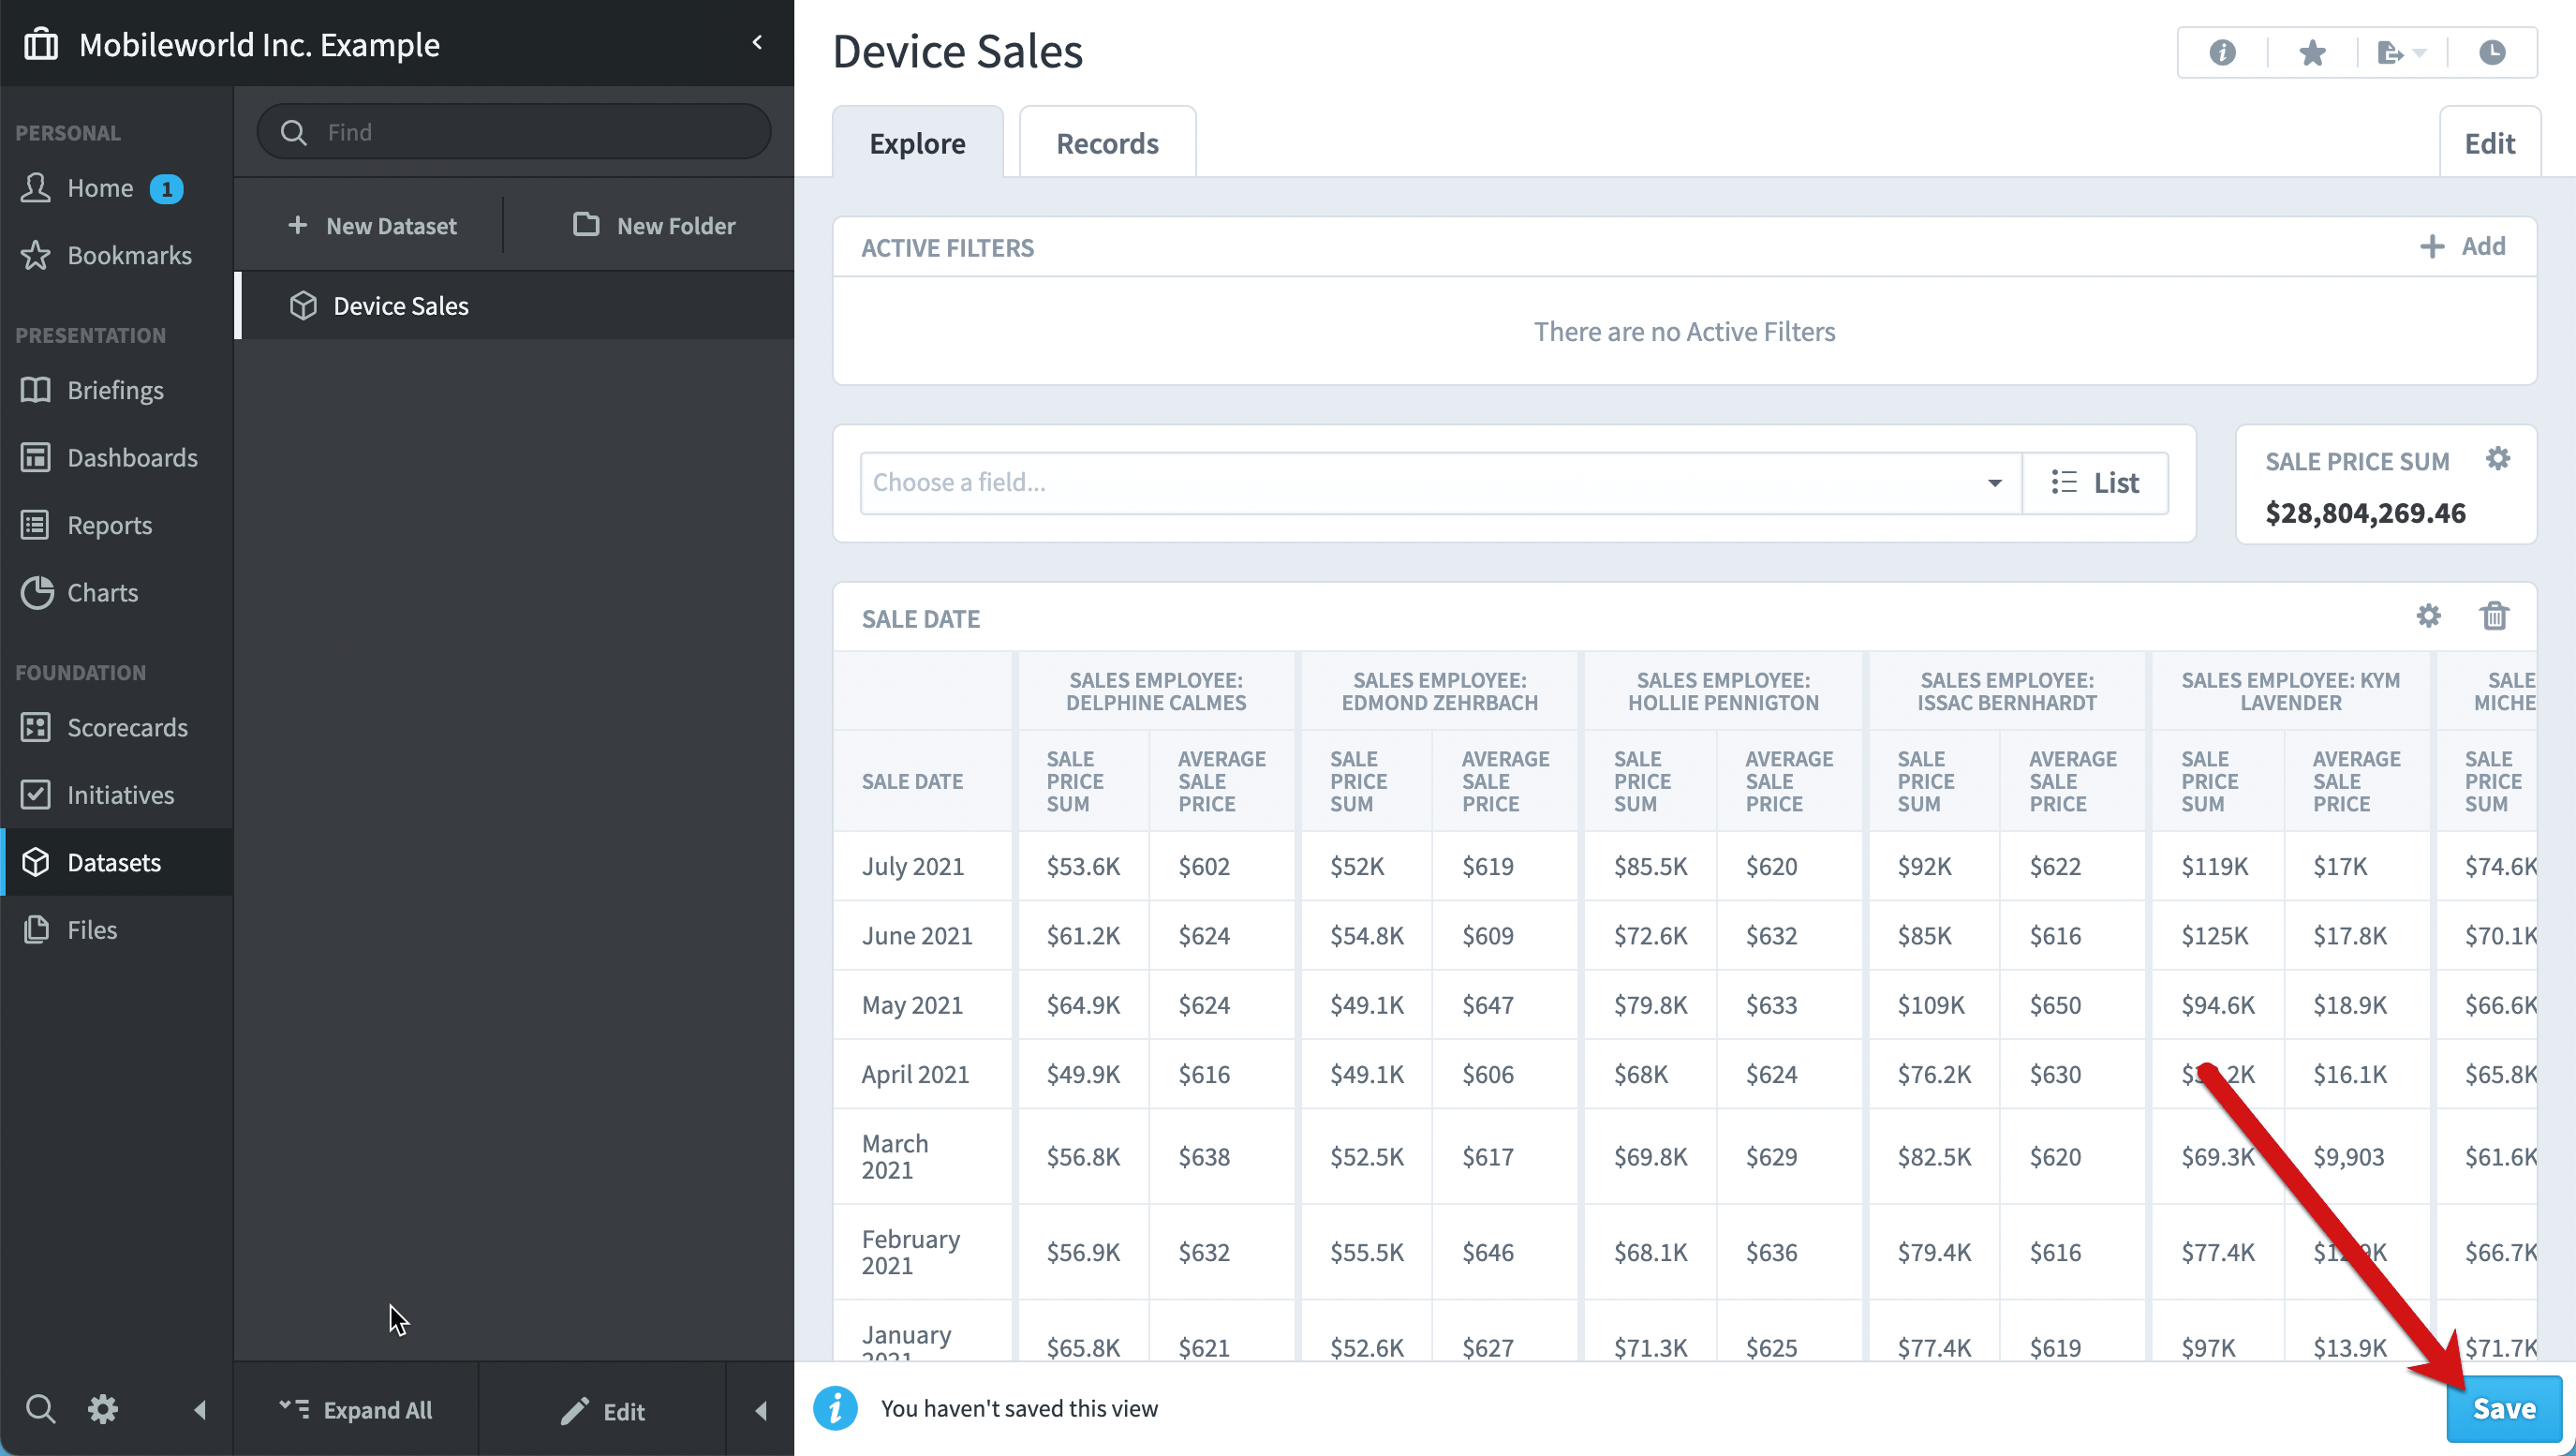
As mentioned earlier, the Datasets section is not meant to be a presentation tool. There are times, however, when you’ll want to save the tables and filters that are on the Explore tab so you can view them later. All you need to do is click the Save button on the bottom…
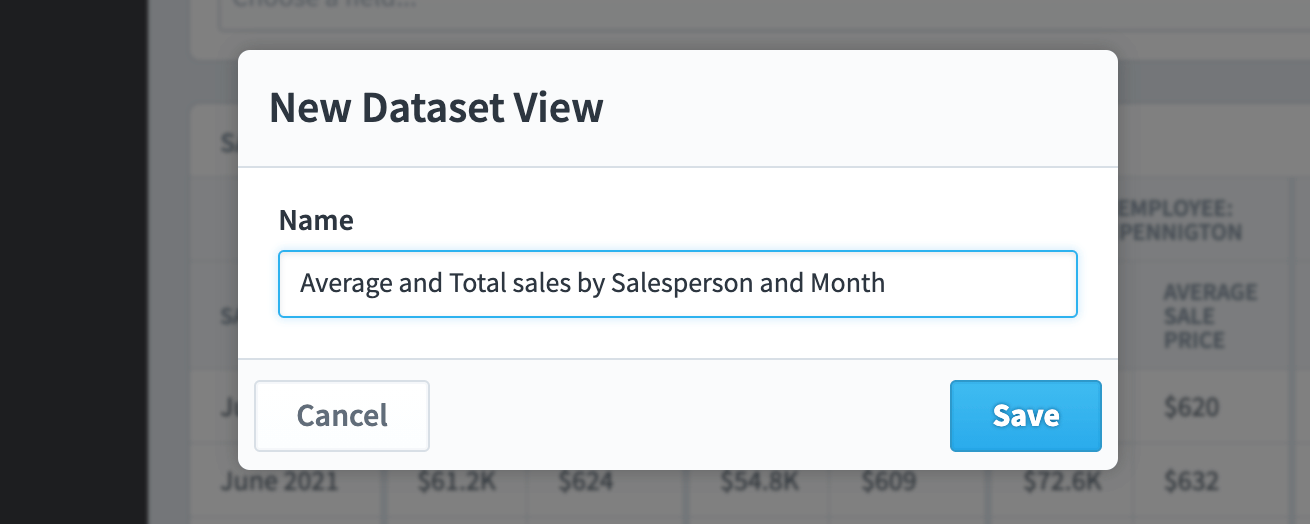
Give the Dataset View a name…
And it will add your saved view underneath the dataset in the navigation pane.
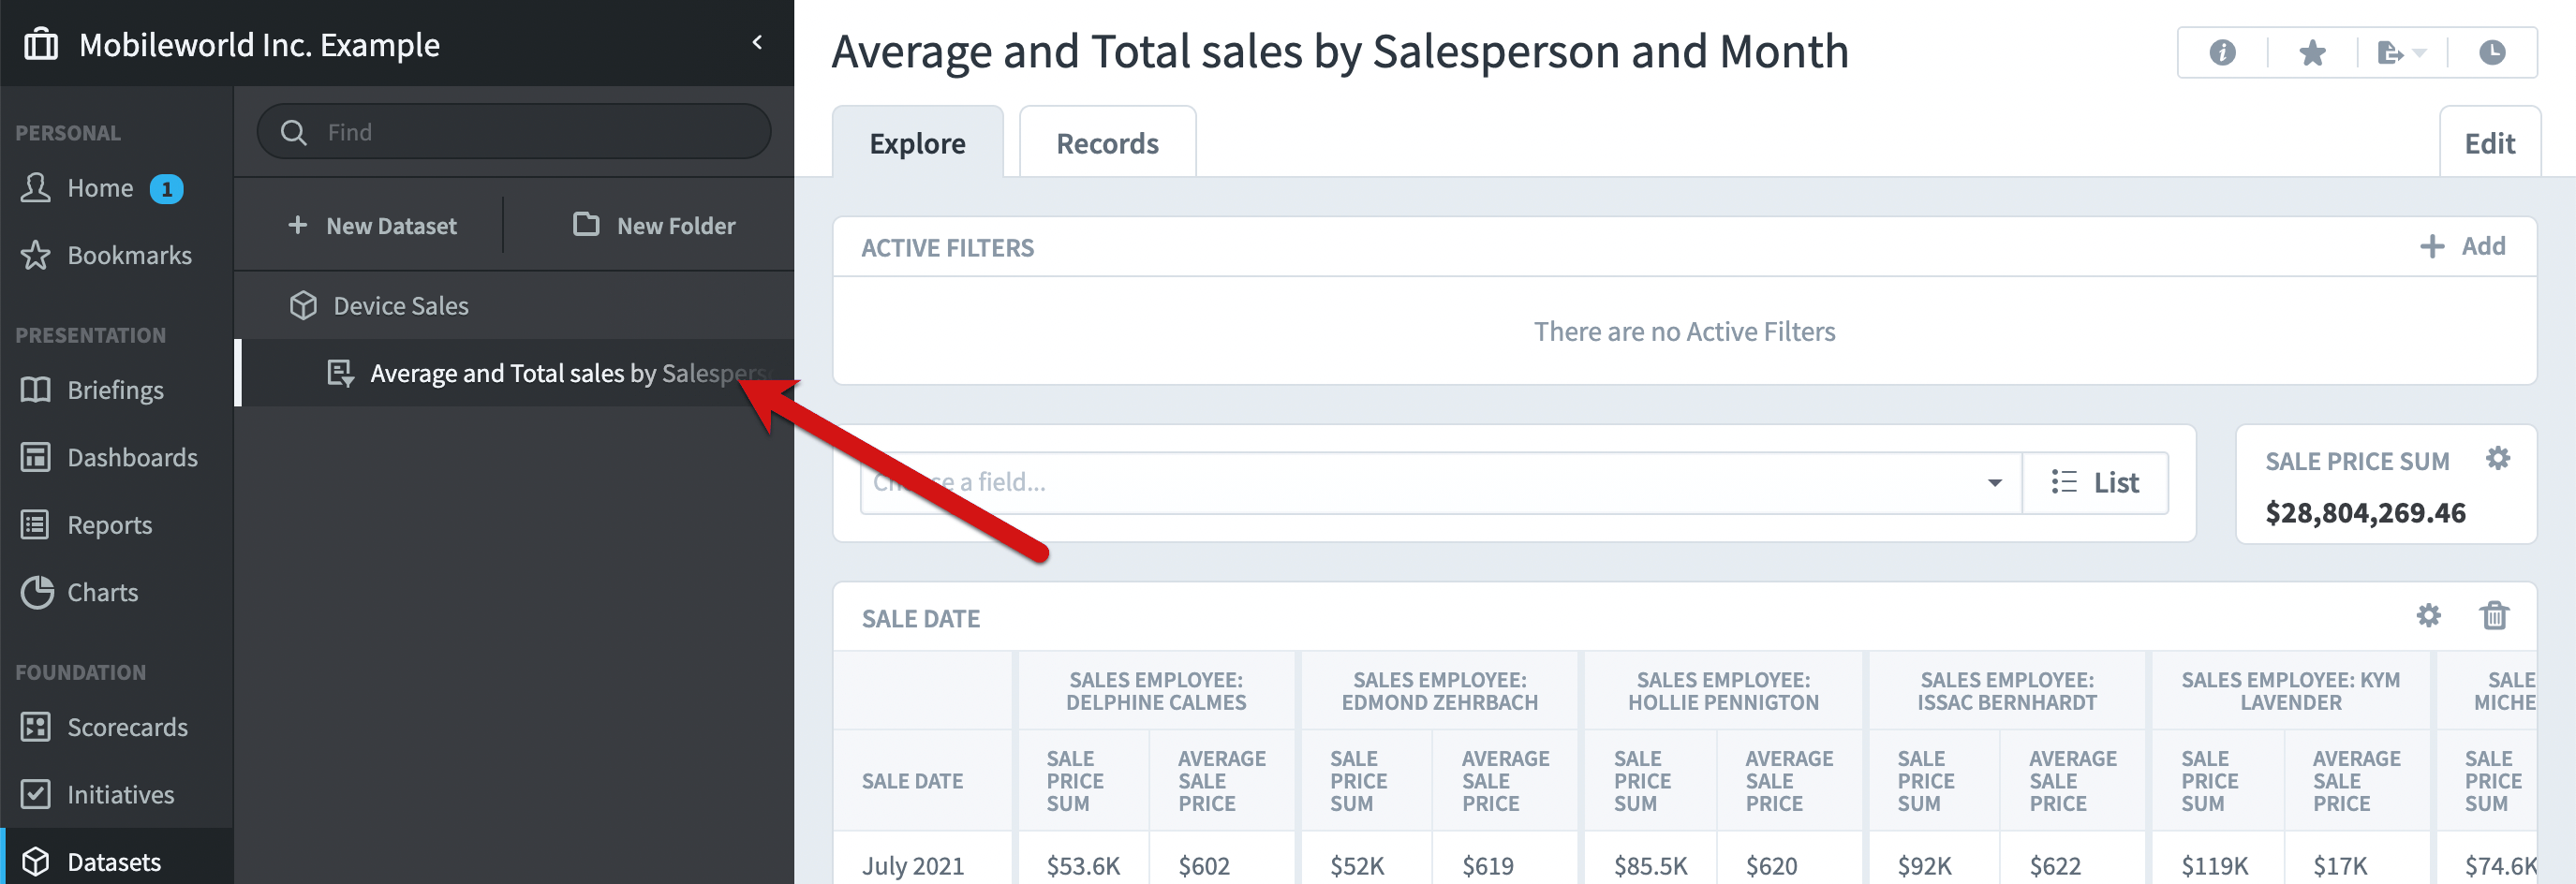
You can use dataset views as starting points for further data exploration, and they’re shared by everyone who uses the dataset.
