
Introduction
Cascading Scorecards within the application is a relatively simple procedure. However, it will only work successfully if a considered approach is taken before embarking on the process.
There are several ways a cascade can take place, here are a few examples:
- Exact Match Cascade (with auto roll-up) (see the guide)
A master Scorecard is created and an exact ‘structure’ replica is cascaded to teams within a department. Typical examples of this approach can be seen in call-centres when all of the team Measures are the same as the management Measures, or in a safety Scorecard where the same Scorecard is used across multiple departments. - Measure Calculated Roll Up Cascade
Targets are set at departmental levels (usually financial) and the values are rolled up to the top-level Scorecard. For example, a sales revenue target is set across several sales groups and the result is rolled up to a company level Scorecard. - Linked Element Scorecard (see the guide)
A Scorecard is created with all of the required Measures and appropriate Measures are linked into other Scorecards. For example, an executive incentive Scorecard that is distributed to a set of directors. The managing director will hold all of the Measures and they will be shared across the reporting directors. They might be weighted appropriately. - Strategy Scorecards (see the guide)
A top-level or executive Scorecard is created and some objectives are cascaded exactly and others are cascaded but the names change to reflect the departmental activity. For example, Improve Customer Satisfaction at the top-level might be translated to Improve Customer Information Responses by the Marketing department.
The application can be used with all of the scenarios above (and more) but again, it must be stressed, careful consideration needs to be given to the cascade before building the Scorecard.
The following provides information about Measure Calculated Roll Up Cascade.
KPI/Measure Calculated Roll Up Scorecards
There is frequently a requirement to ‘roll up’ actual values to a top-level scorecard. Typically this might be in a sales area where the sales teams revenue needs to be rolled up to a company level. Or this could be a customer satisfaction score across multiple customer facing departments rolled up to a total or average company score.
In these instances, rather than copying the whole scorecard, individual measures can be copied and then a calculation performed at the top-most level to aggregate the actual values from the lower-level measures.
For this example we will look at rolling up the Sales Revenue measure to the company level from three sales teams that reside in the sales department.
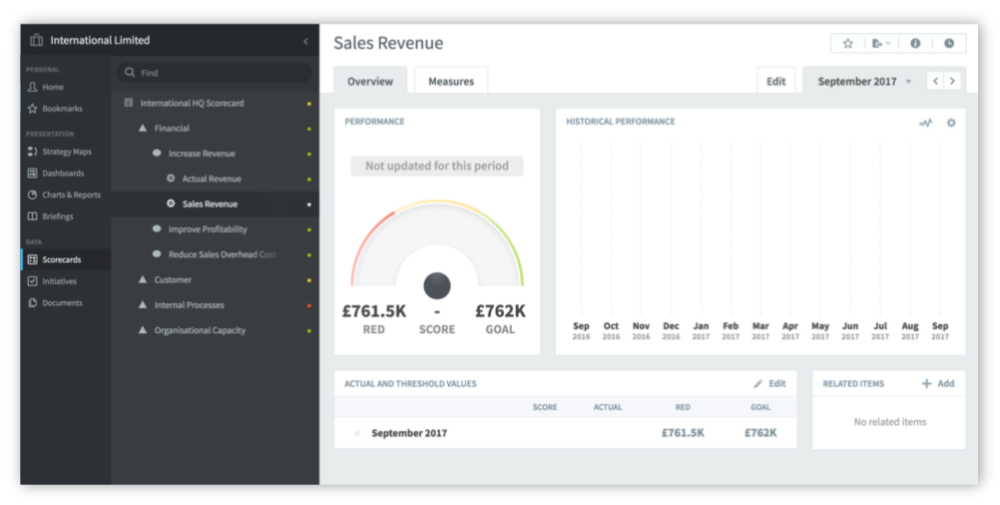
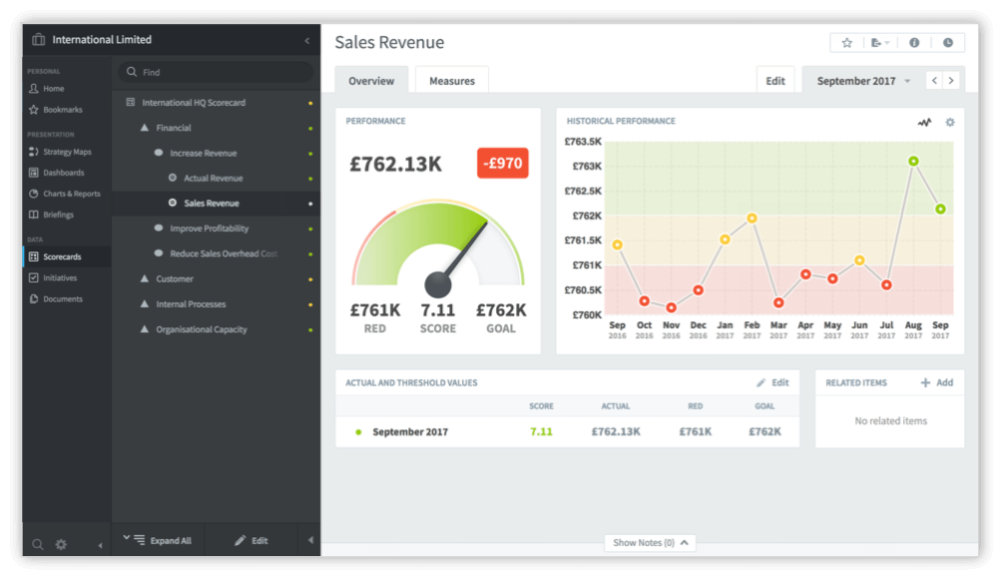
A company scorecard might look something like the one above. Here we can see the KPI/measure Sales Revenue. This needs to be defined in the first instance. If you have not defined measures before, go to the Getting Started Guide and create a scorecard first.
These examples can be seen in our free-to-view system:
user name: sam
password: smith
“https://intrafocus-v3.qs.spiderstrategies.com/”
By clicking on the Briefcase icon the organizational structure is revealed.
For this example we will be looking at the three departments in sales.
- Private Sector
- Government
- Education
These scorecards contain the source Sales Revenue measures that we want to roll up to the top level scorecard.
You will need to identify or create your source measure before the next step.

Click on one of the source measures and check it has been created properly and has some data (actual values) added. In the example below we can see the Private Sector sales team scorecard with Sales Revenue:
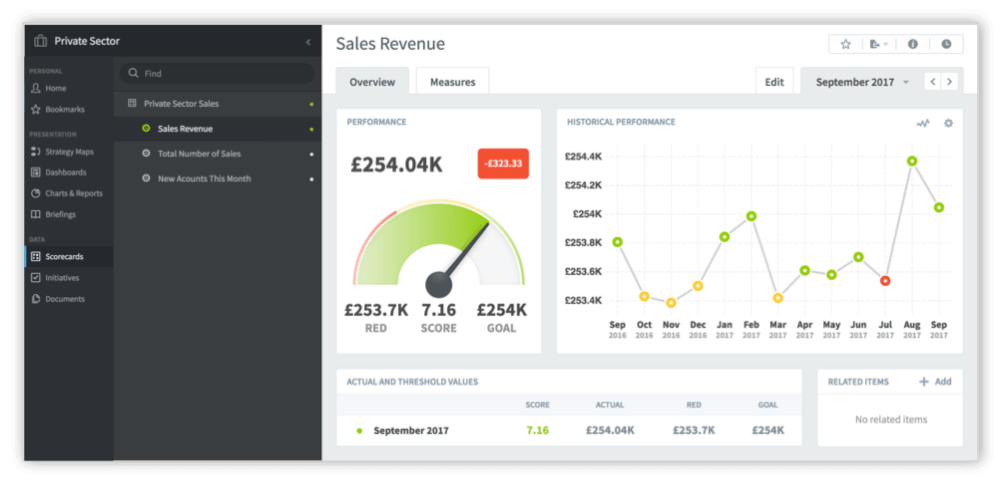
Check all of the other source measures.
Go back to the measure that you want the values to roll up to. For this example we are looking at International Limited > Sales Revenue:
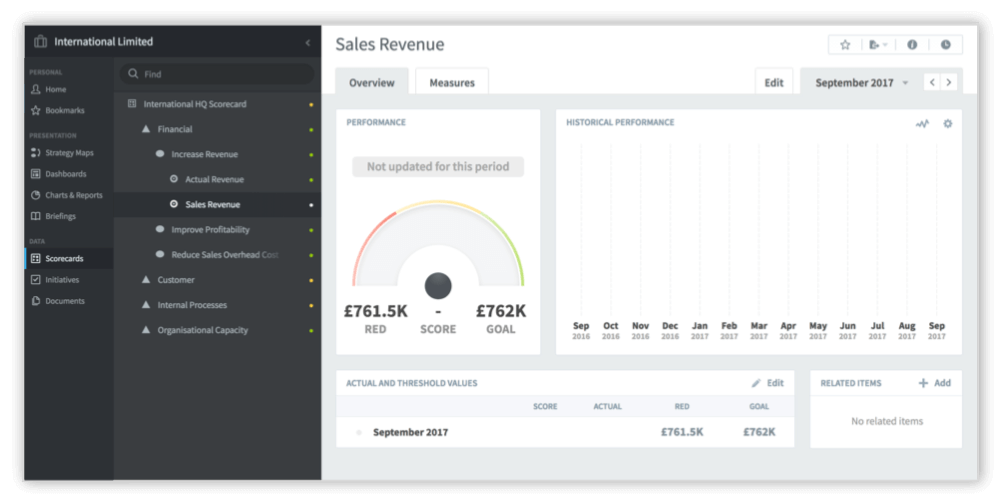
Notice that there are no ‘actual values’. These will be ‘calculated’ from the previous three measures. Click on the Edit tab to reveal the edit measure screen and scroll to the third box called Series:
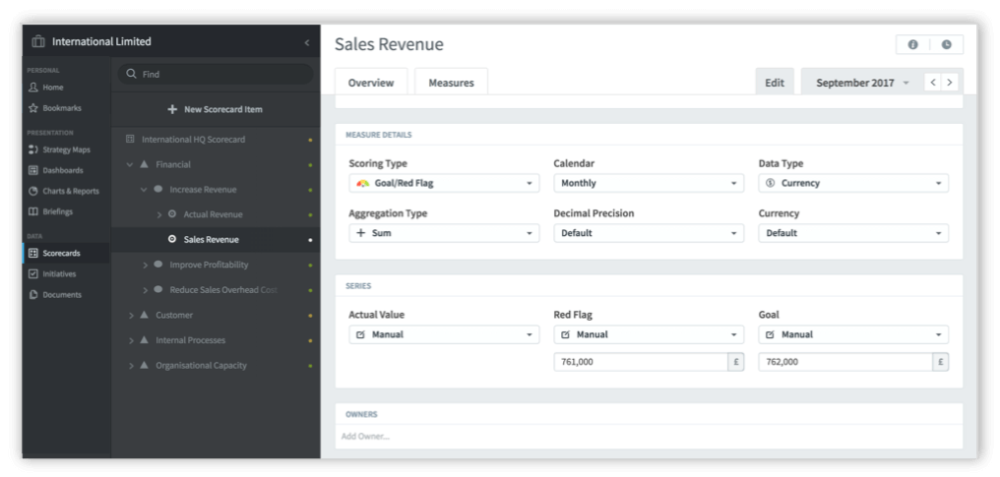
In the Series box you can see that the Goal (green) and Red Flag (red) values have been set. We now need to create the calculation for the Actual Value to sum the Private Sector, Government and Education Sales Revenues.
Click on Manual under Actual Value and select Calculated.

Click on Set Equation to reveal the Set Equation dialogue box.

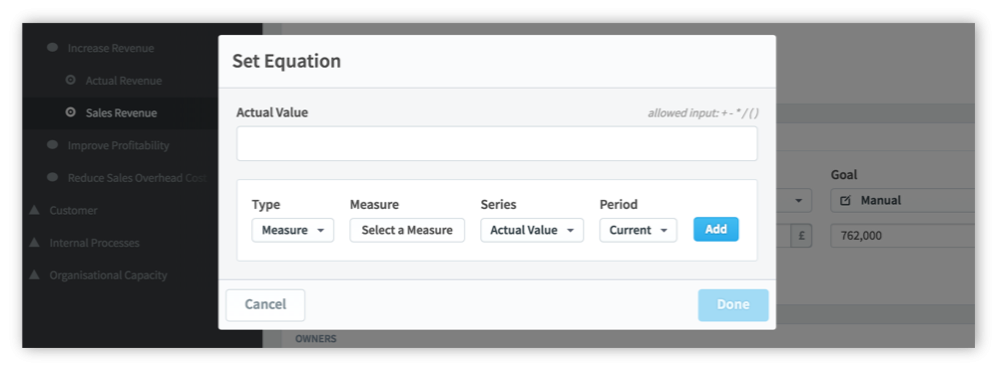
The box under the words Actual Value can be considered as a typical spreadsheet cell. For a list of operands, equations and functions that can be used in this box see the user guide: Calculated Measures.
We are going to be ‘summing’ three measures so will leave the Type as Measure. The Series will remain as Actual Value and the Period as Current.
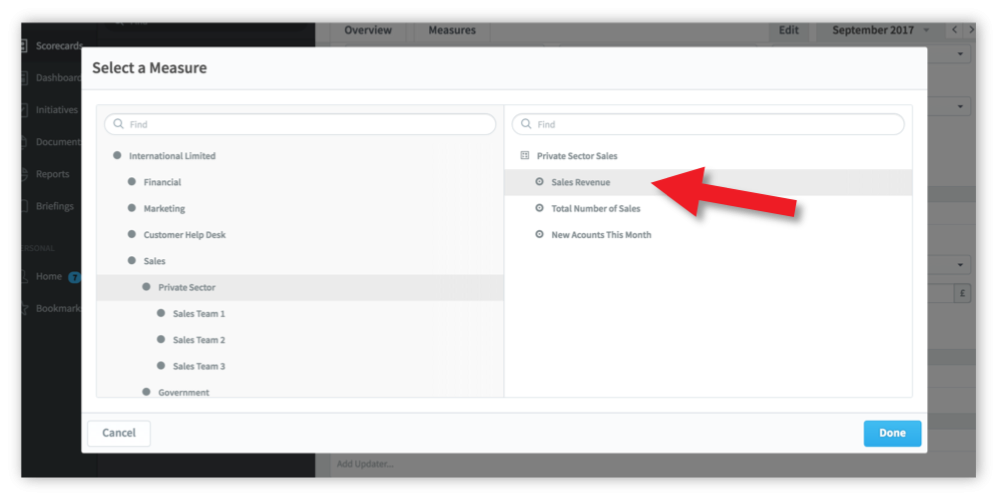
Click on Select a Measure to reveal the Select a Measure dialogue box.
Find the first measure you want to add to the equation, in our example we have selected the Private Sector scorecard and the Sales Revenue measure:
Click Done and you will see the measure appear in the Measure box:
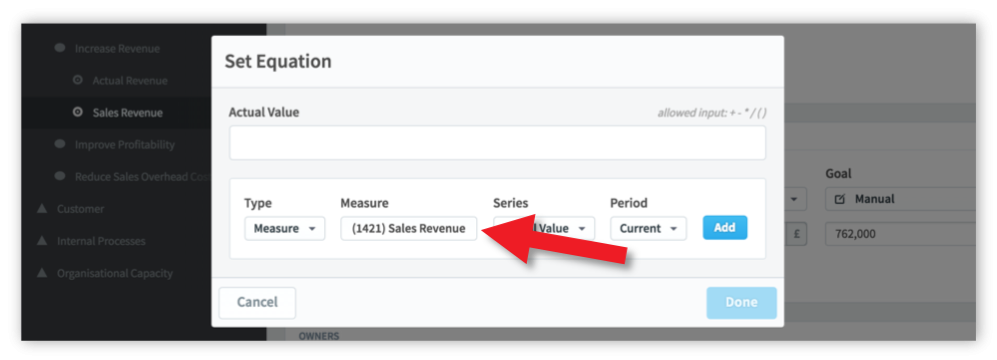
Click on the Add button to add the measure to the Actual Value equation box, notice that the measure unique identifying number has been used:
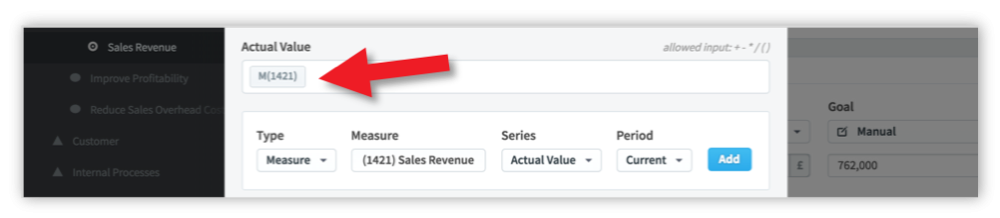
Next type in the plus (+) operand in the equation box and then find the next measure to add to the equation (repeat the steps on Cascading Roll Up page 5). Keep doing this until the equation is complete as shown below:
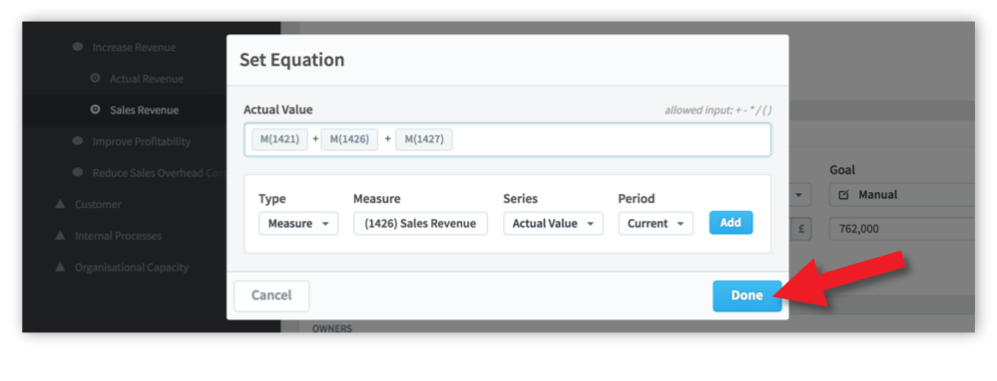
Click Done. The Series box will now look like this:
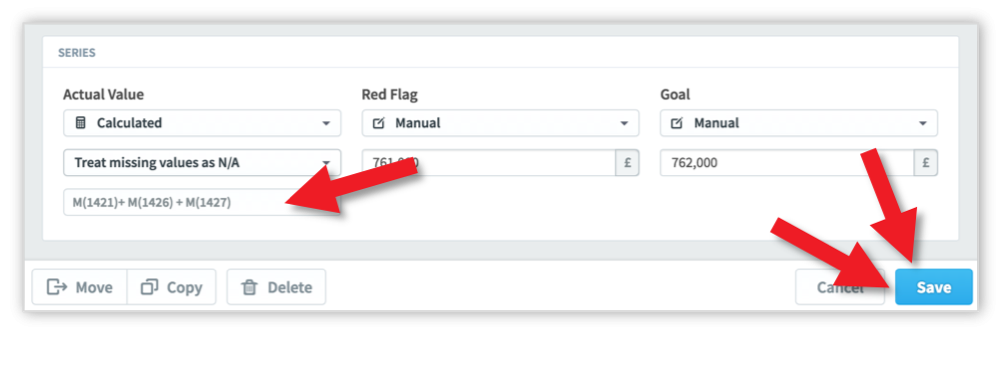
VERY IMPORTANT – Do not forget to click Save at this point. If you do not, your equation will be lost!
Click on the Overview tab and you will see the final result:
Calculated measures can be used in a variety of ways. For more information on how to build calculations into your scorecard see: Calculated Measures.